Menstrual Clock. / Code
The circle represents the actual period cycle.
Whereas the red arc of the circle represents the time actually bleeding. In this case, the program takes the average, 28 day cycle with 6 days of bleeding.
I think an interesting/practical place for my clock to live is on the landing page of a period tracker app. It can live in the background as the user checks through their calendar / expected periods. Information wise, it may not as accurate as say, a table chart, but I think the visual representation can be a nice touch to the app.
In the future, I would like the day that the period starts and the length of bleeding + period cycle to be dependent on the actual user, and take data from previous cycles.
Process
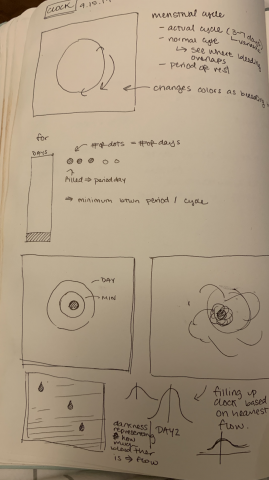
I originally intended this clock to be used over the course of days, and the fluid simulates the actual flow of a period (color getting darker on the last couple days, starting off little and peaking on day two, then gradually decreasing). The amount of fluid (density, instead of area), that is being added was intended to be close to a bell curve and I tried using an easing function to simulate this, but my results don't have a drastic change towards the density of the fluid.
As I got my fluid simulation to work, I realized that visually, it works best at a second time step than a day one, hour one, or even minute:


(You can see there are hardly any difference between day vs hour vs minute.)
Therefore, I decided to make the fluid simulation based on the seconds passing, rather than any other time factor (since the density of fluid added wasn't working as well as I hoped anyways, which was also supposed to be set at a day-scale).
Changing between days:

As you can see, the line increases, but because the bleeding period is over, the arc is white.