https://github.com/LingDong-/60-212/tree/master/decSkel
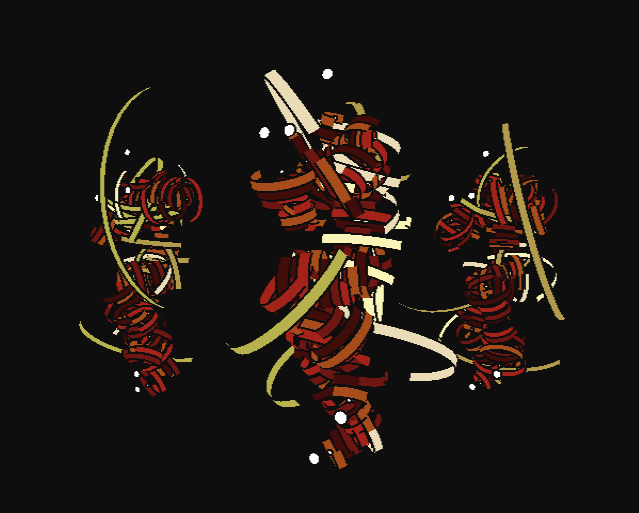
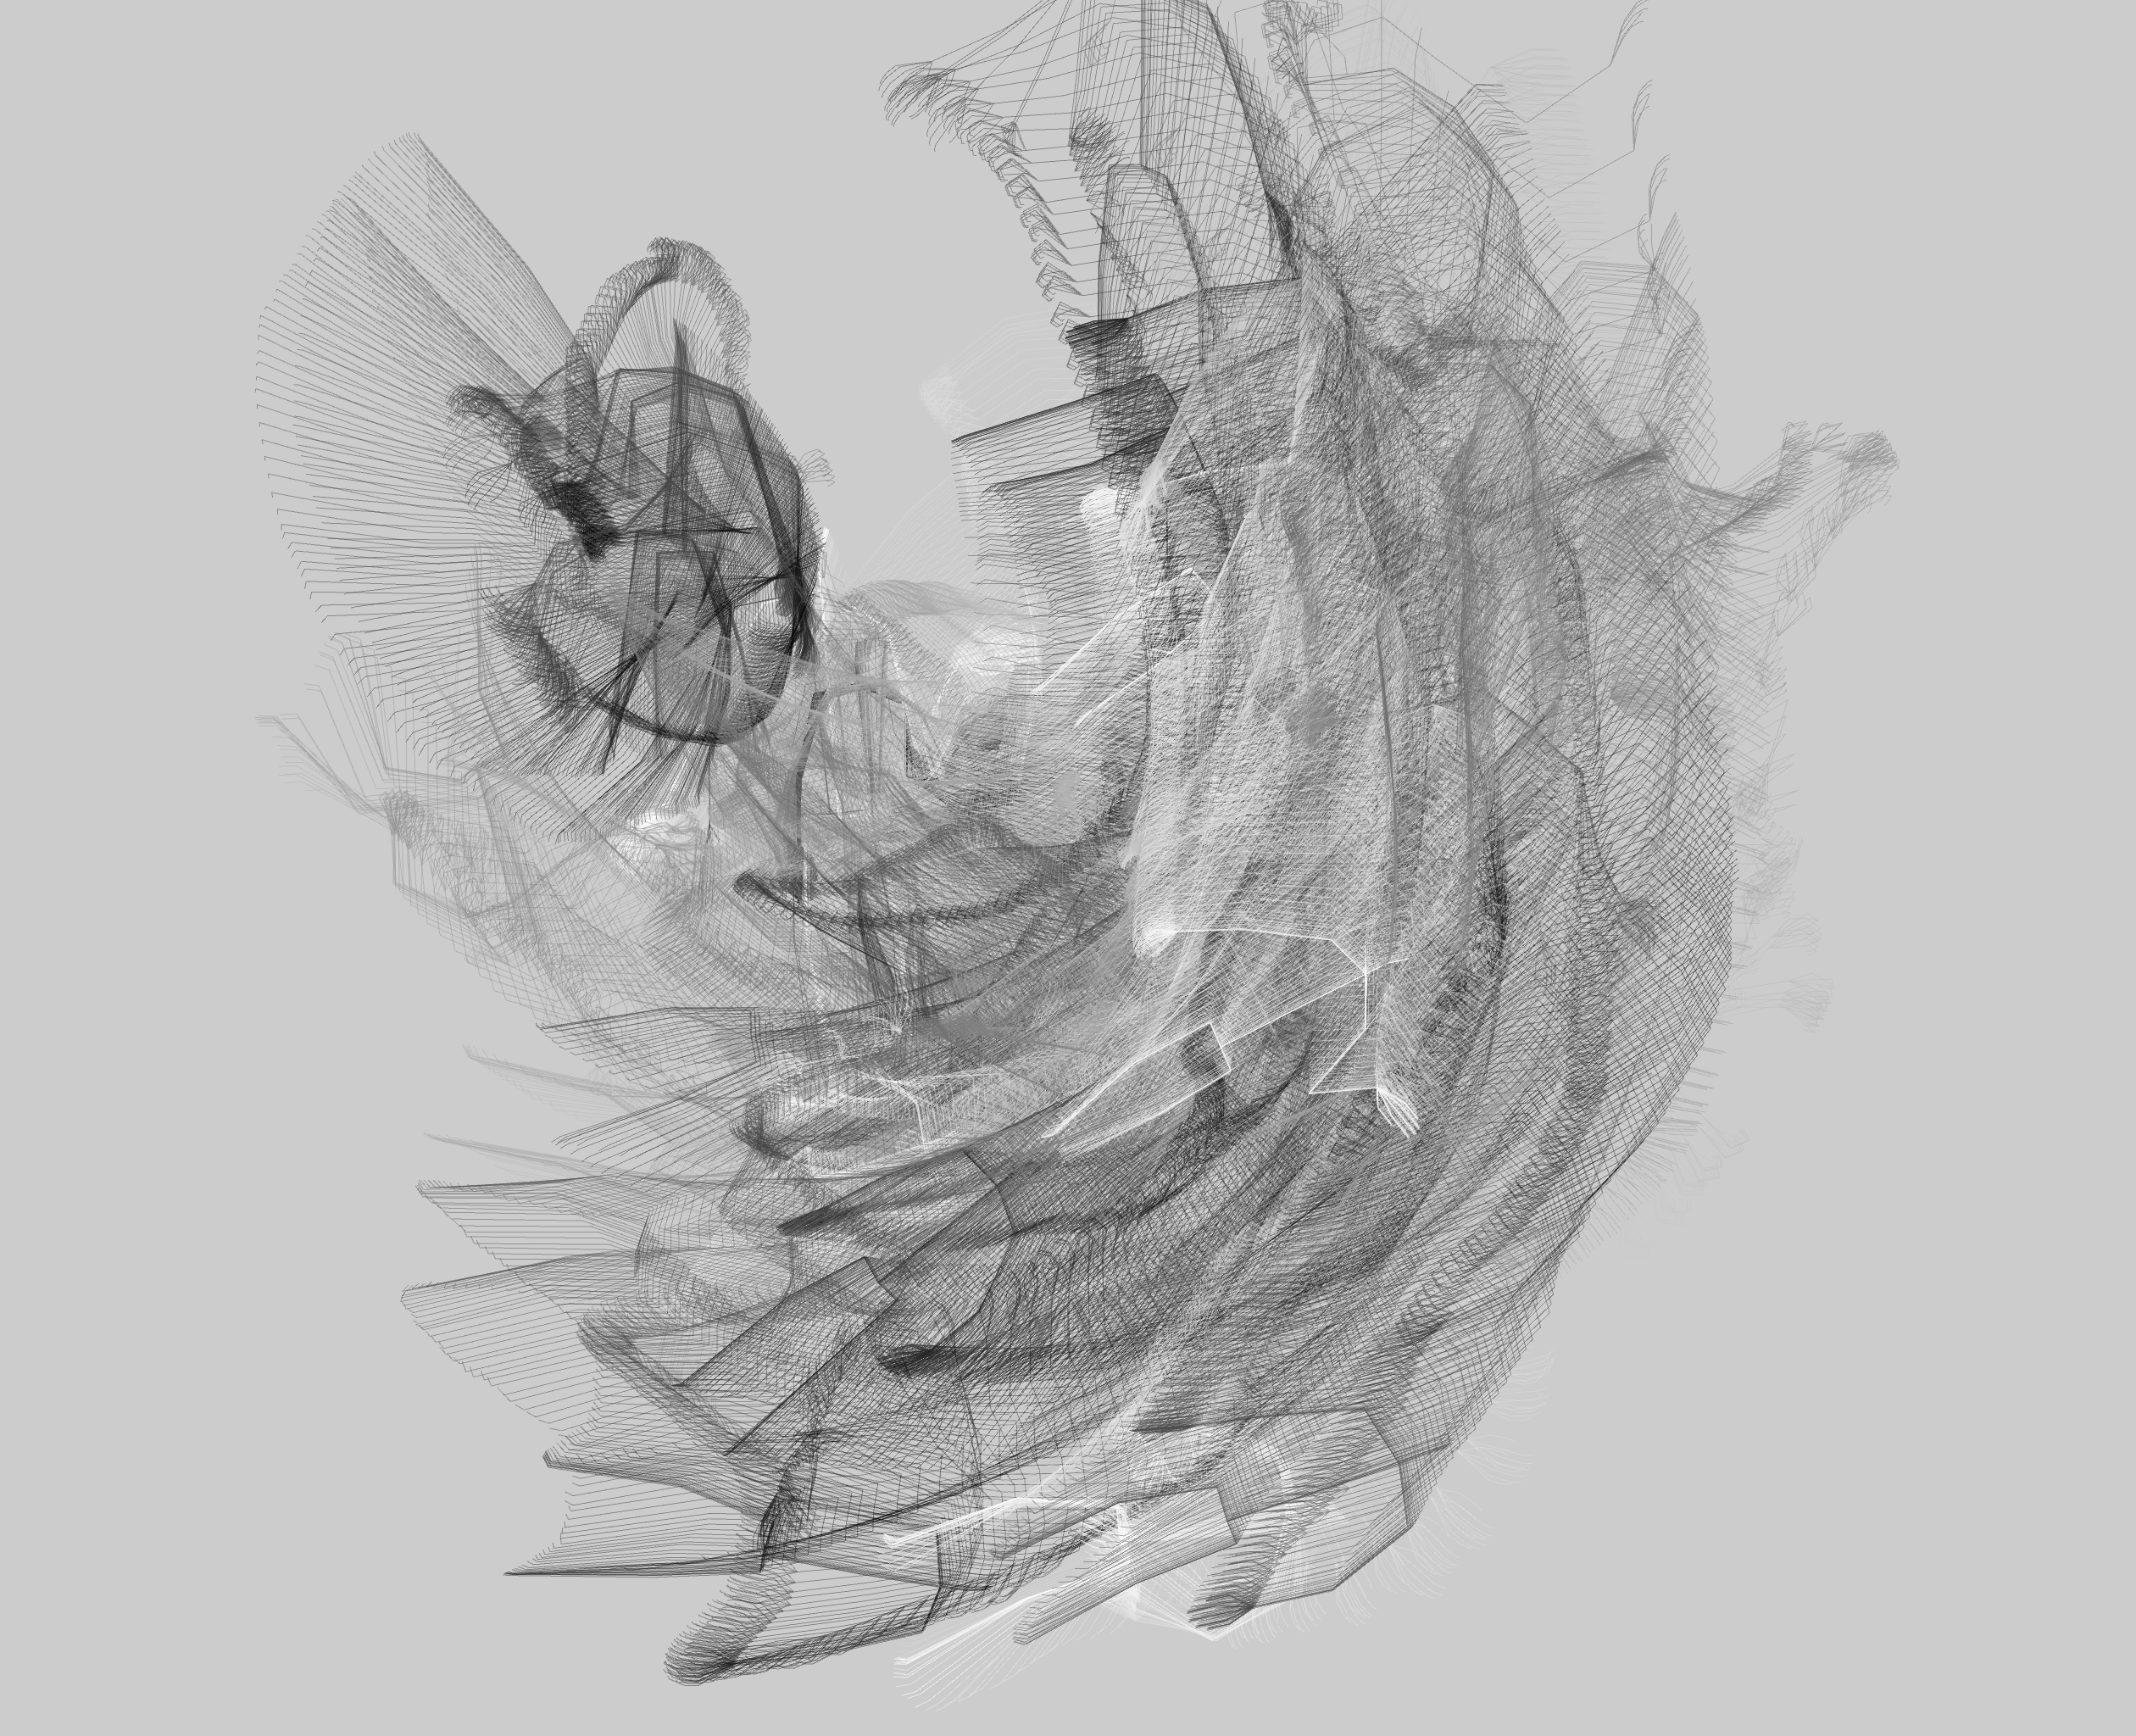
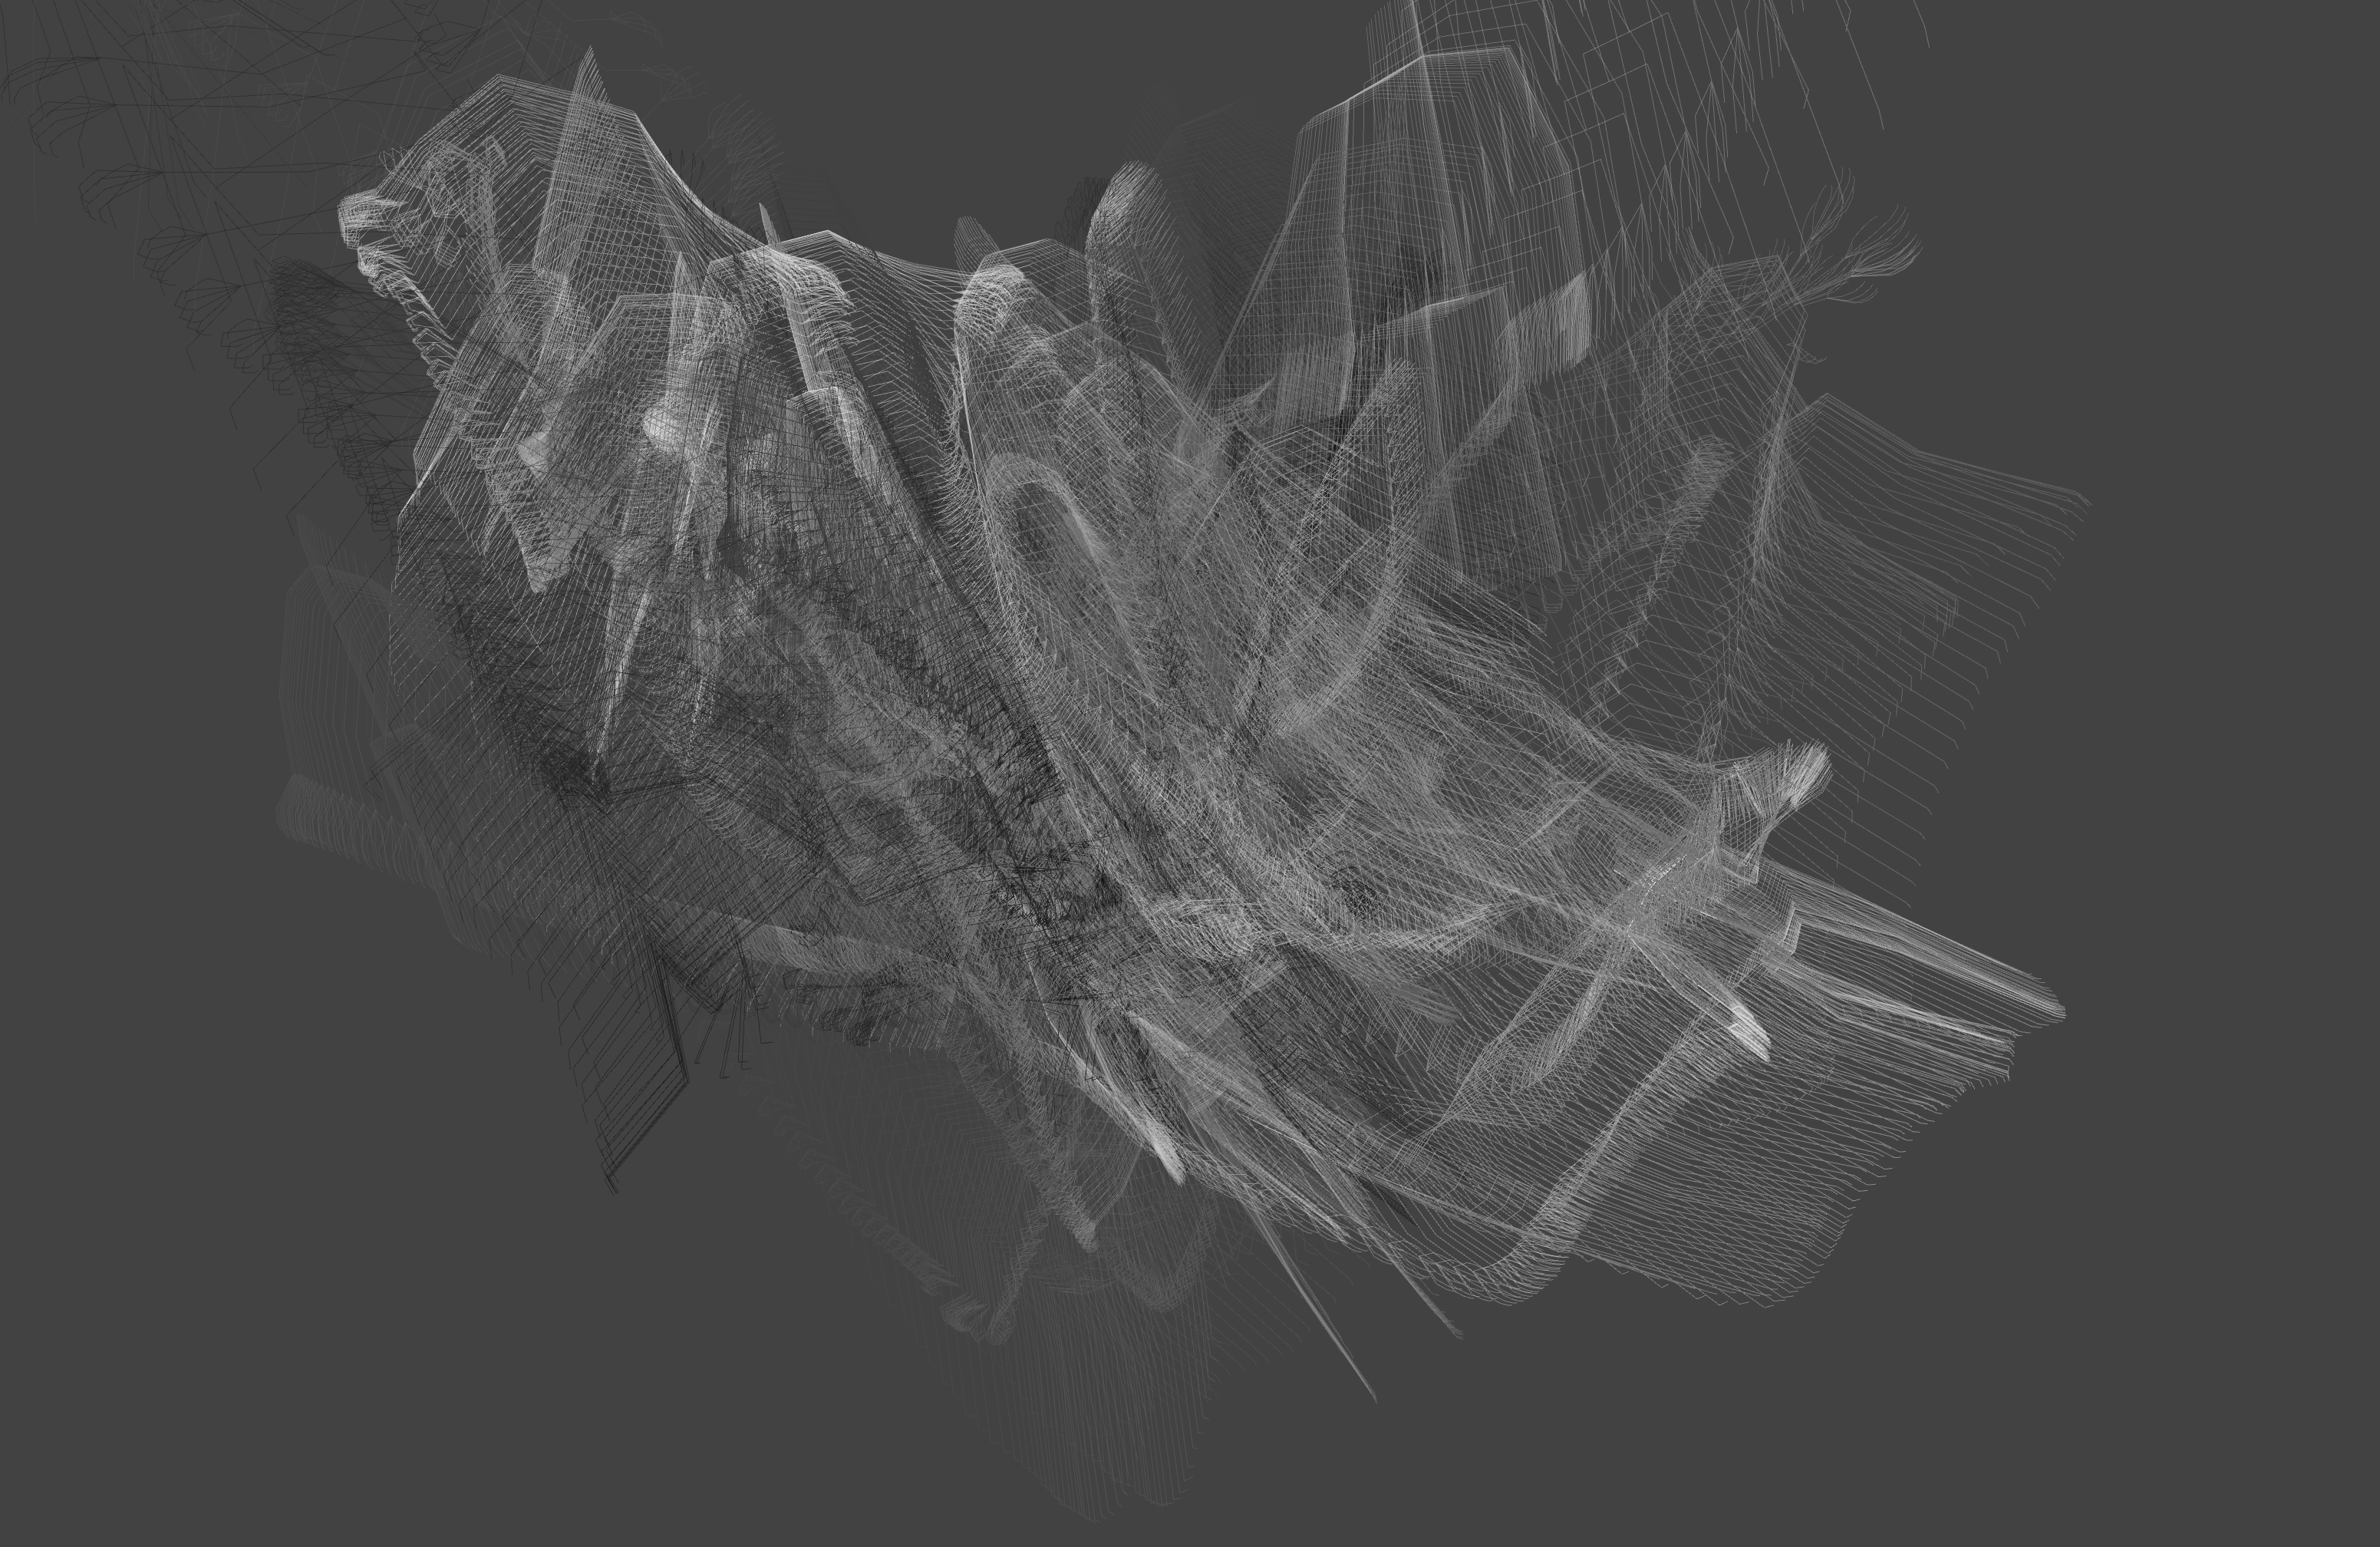
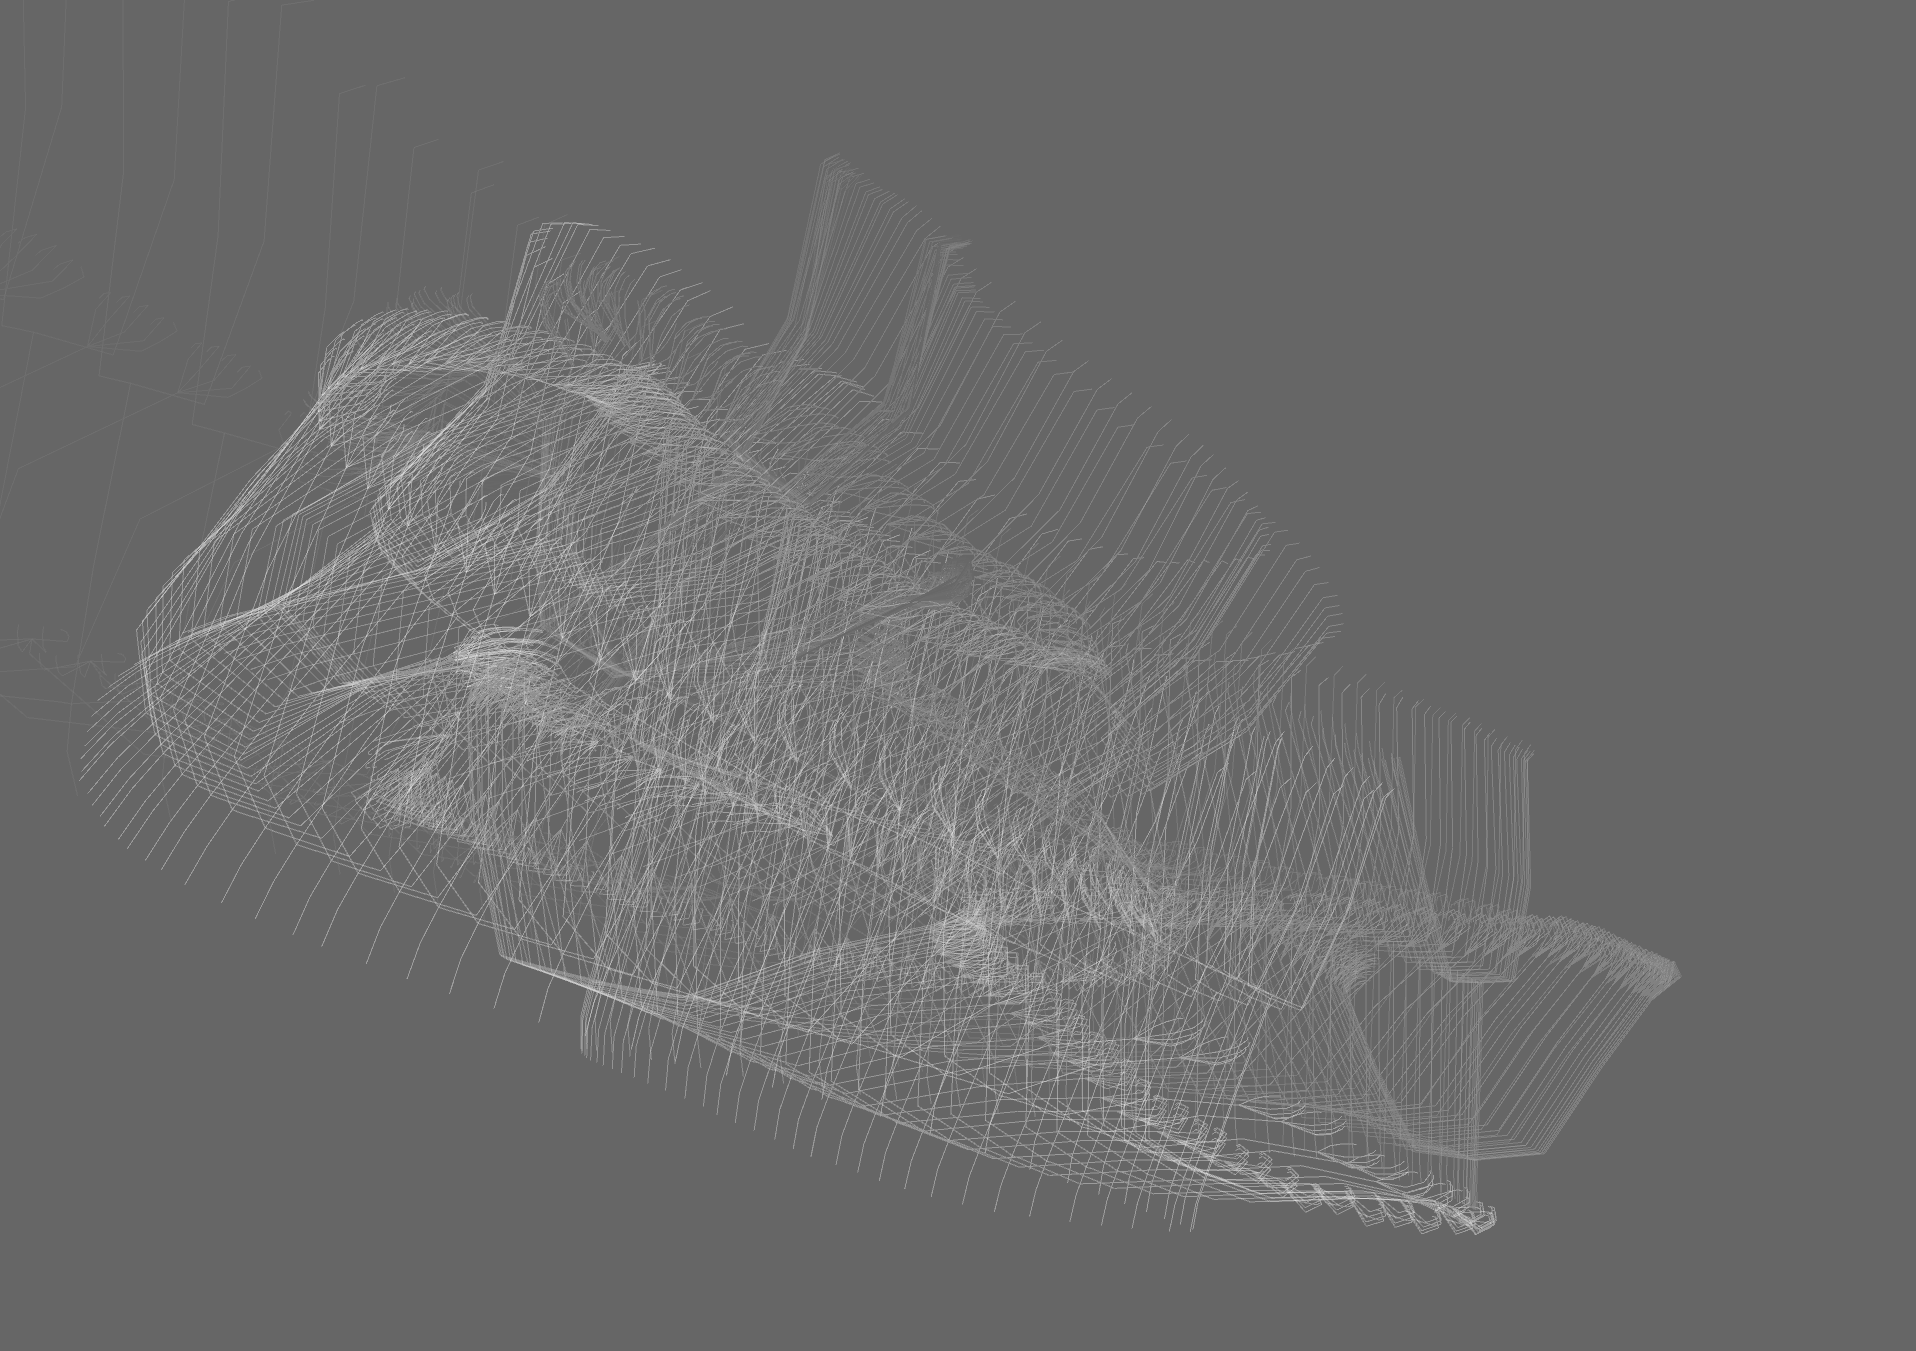
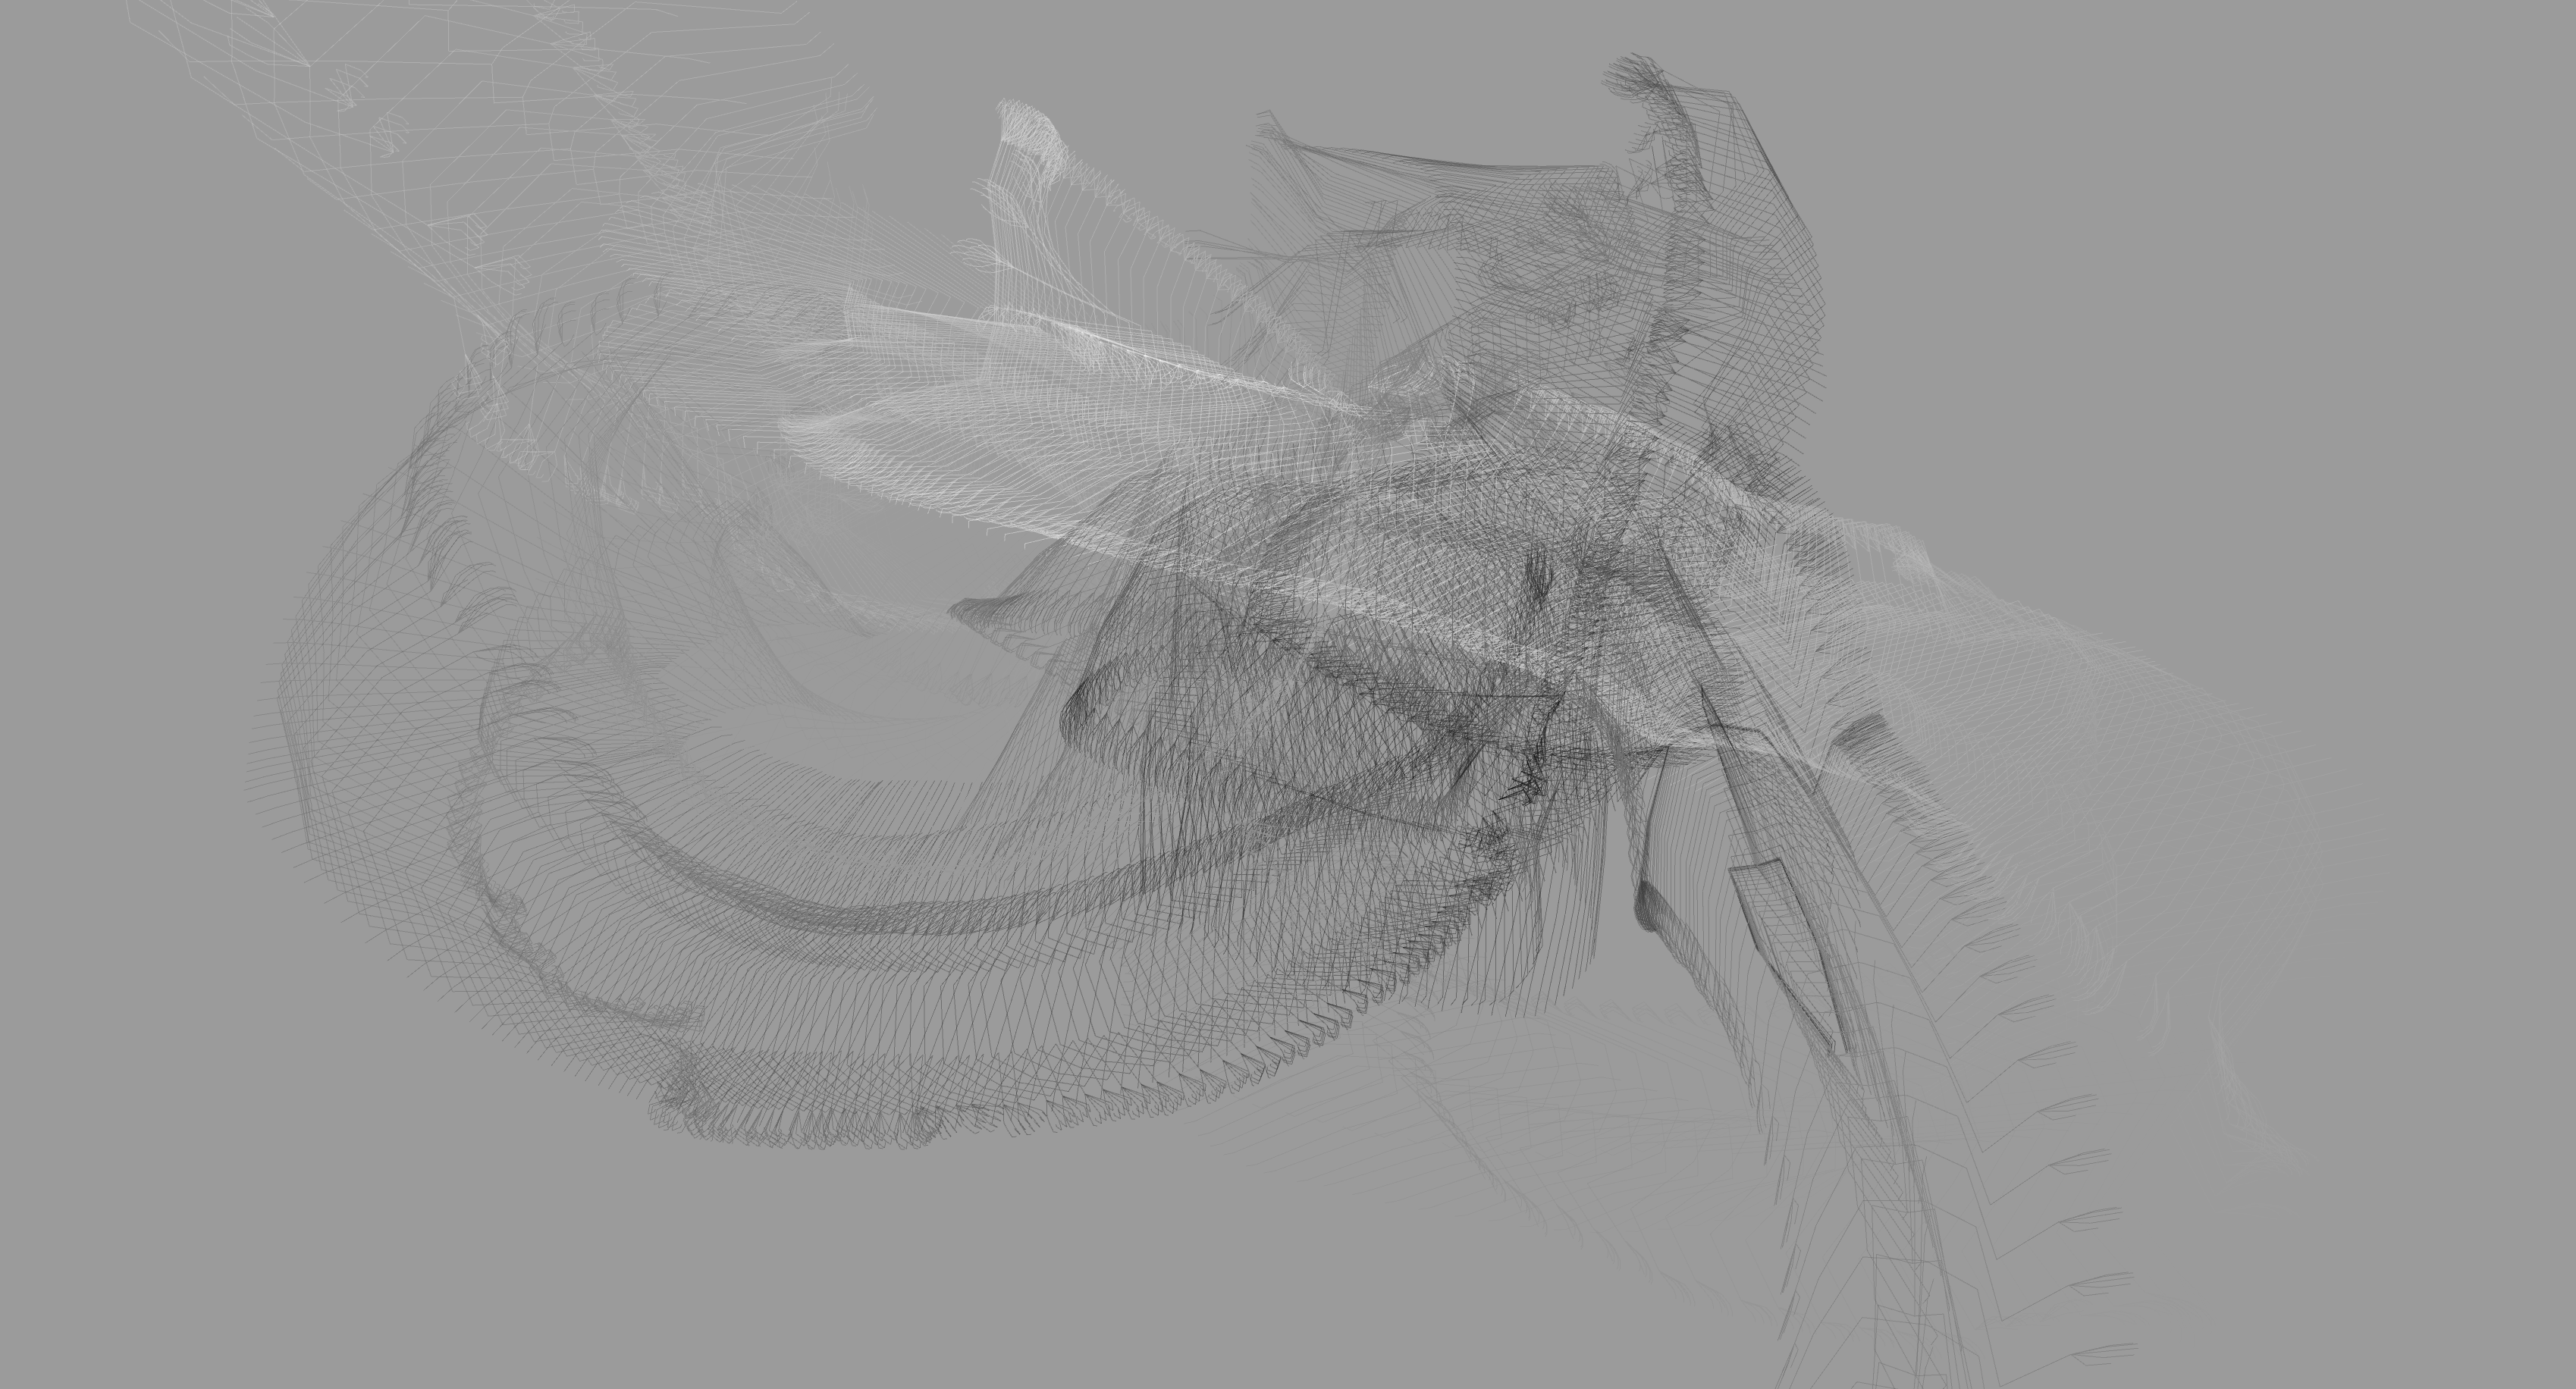
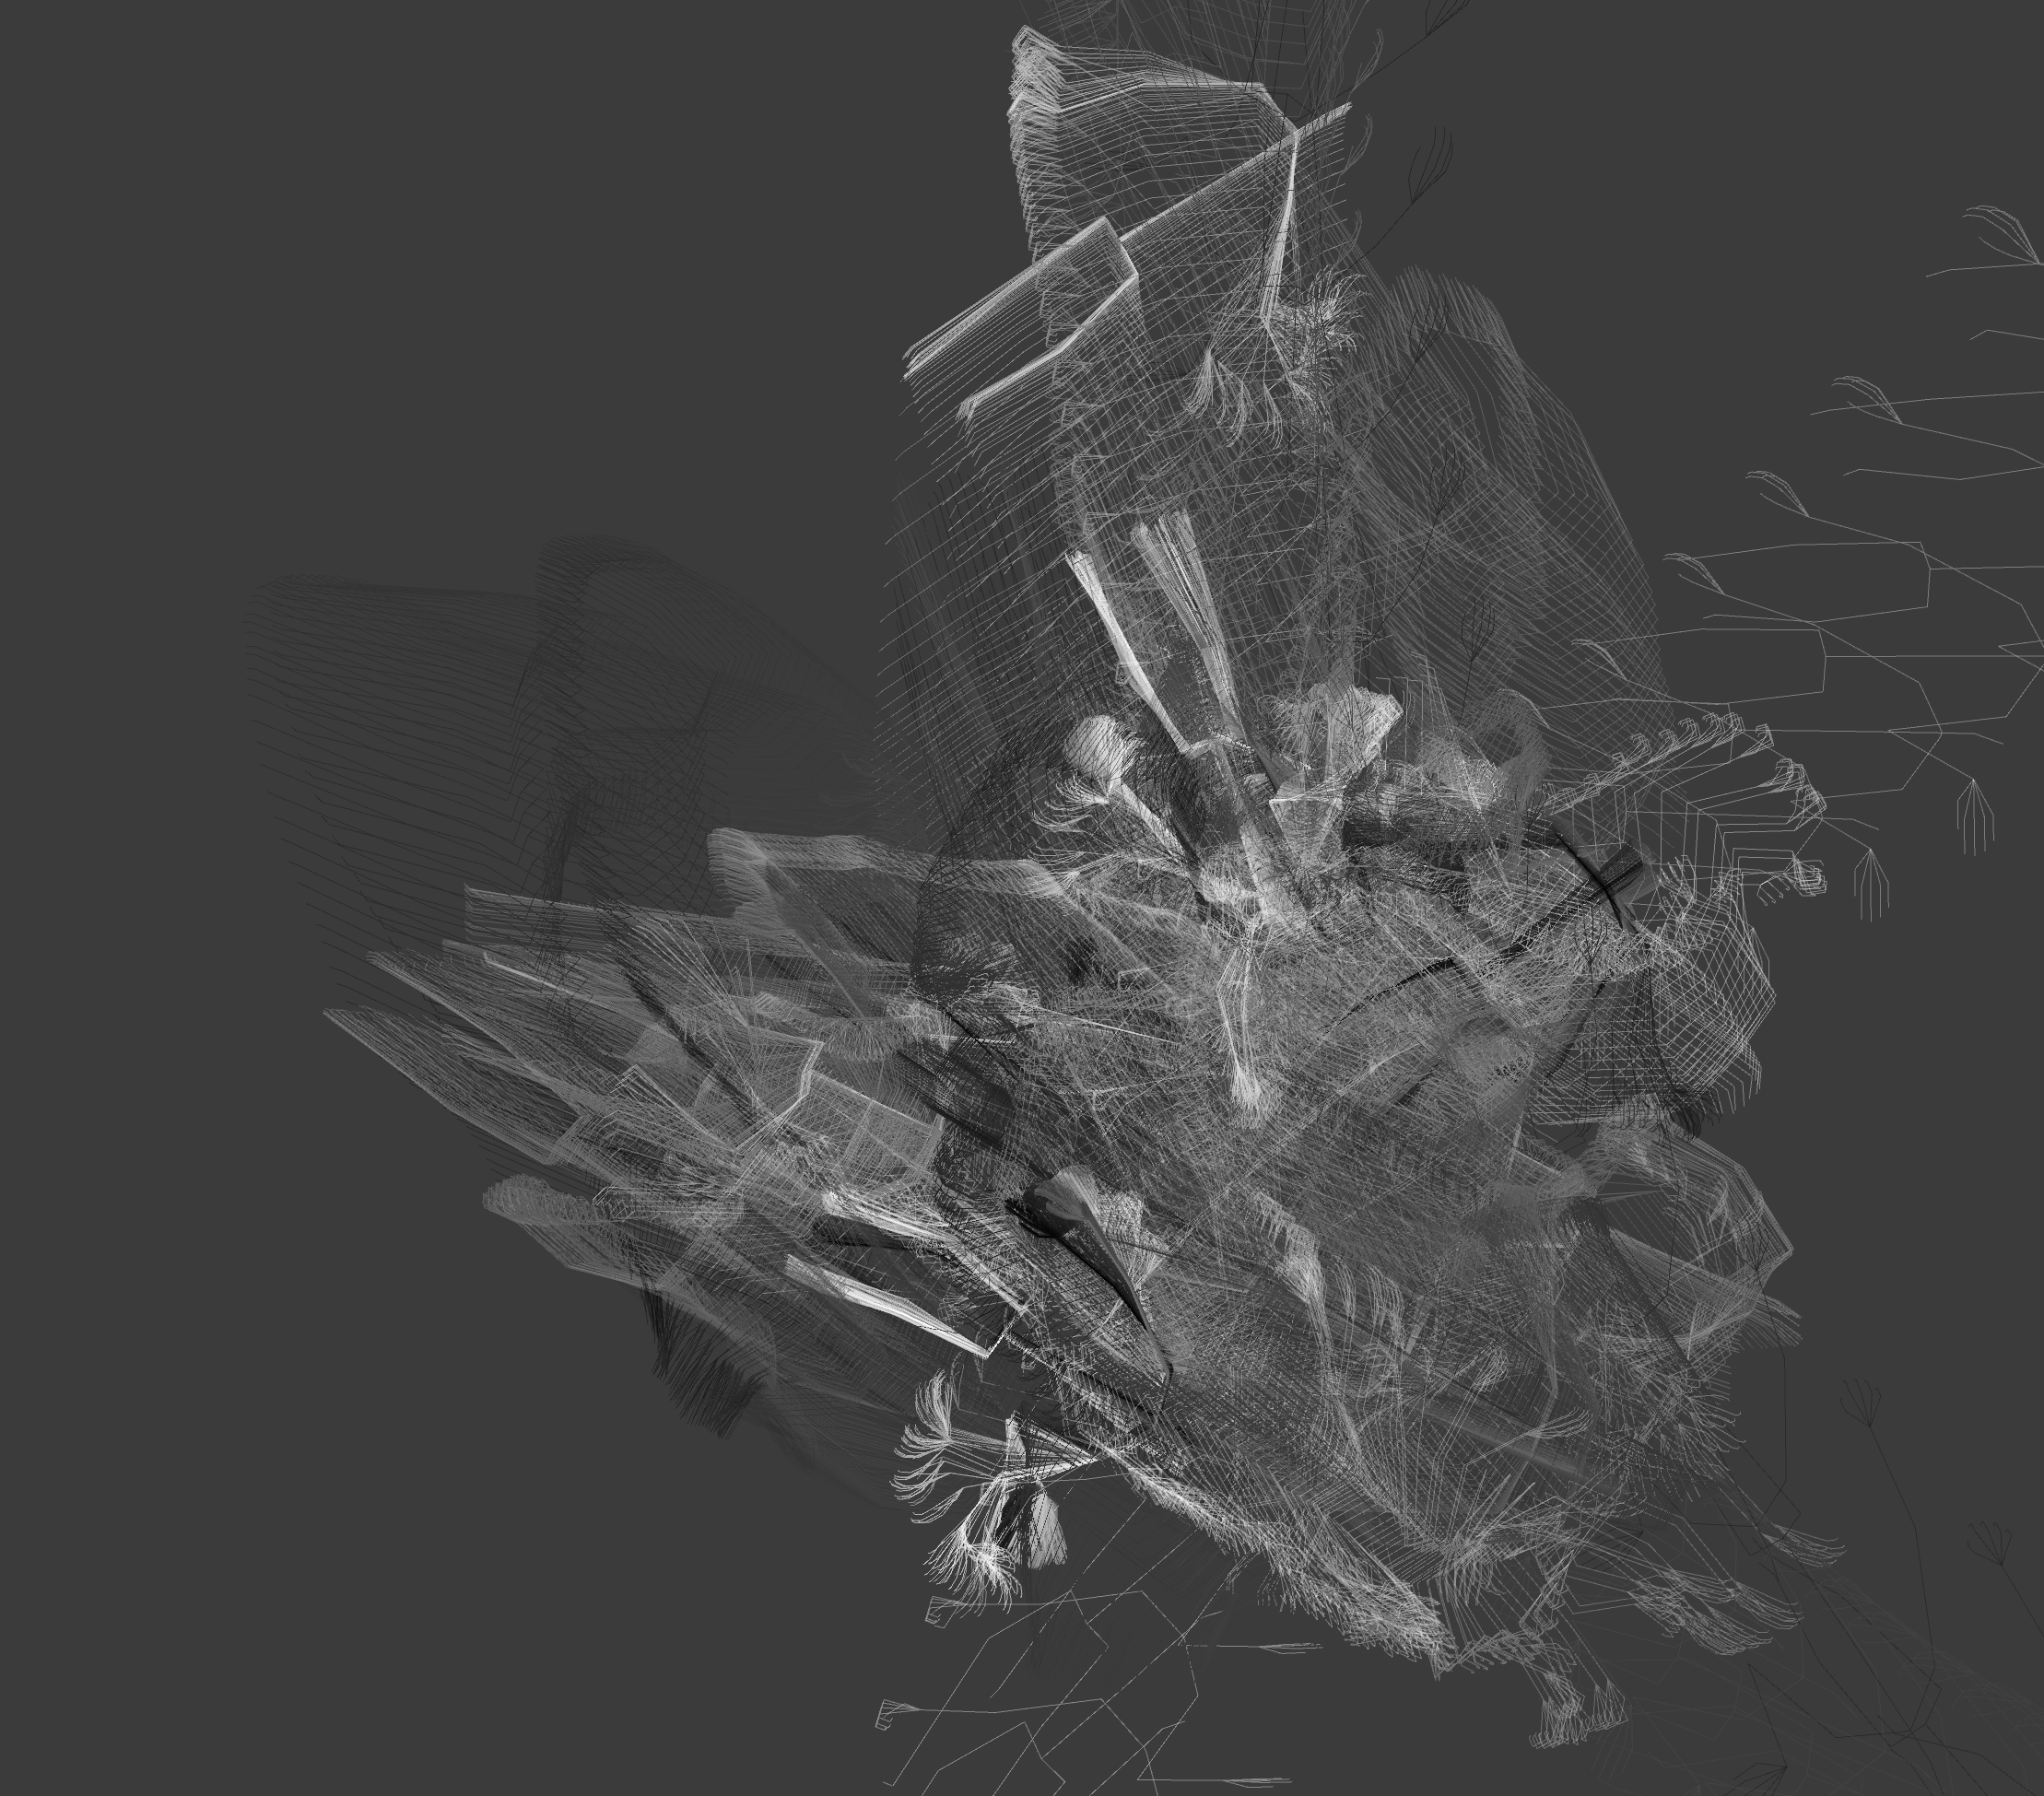
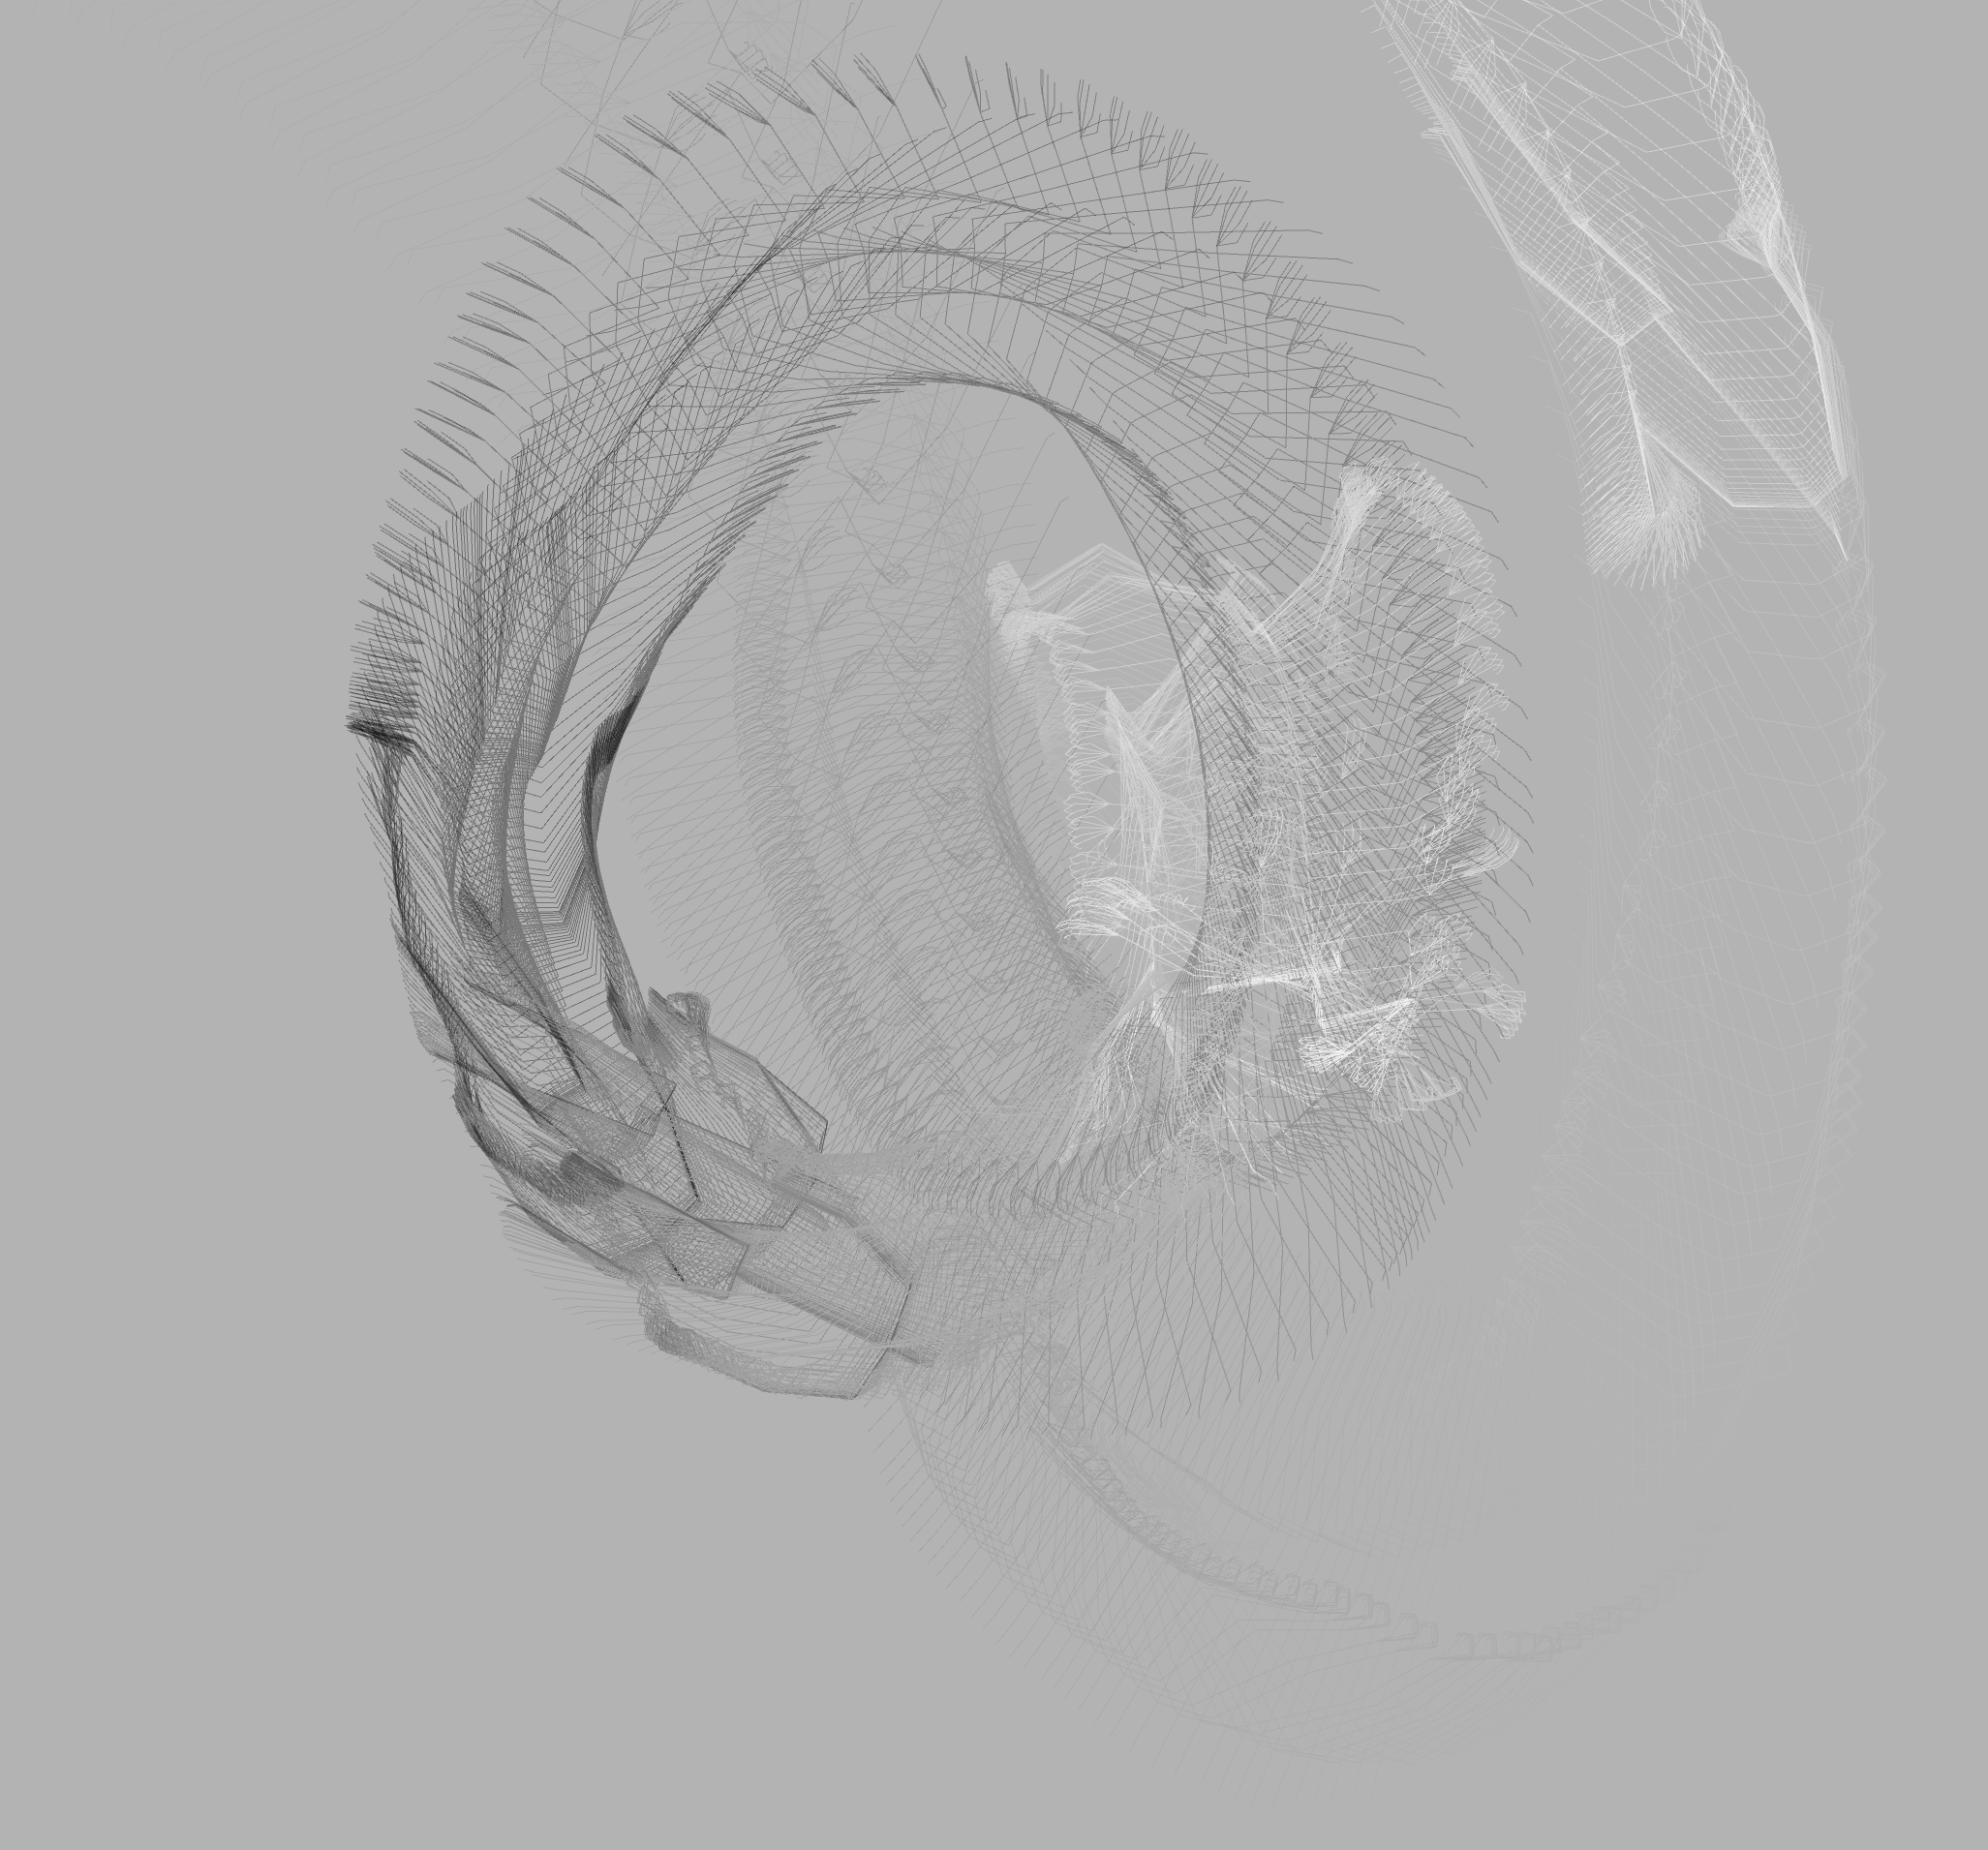
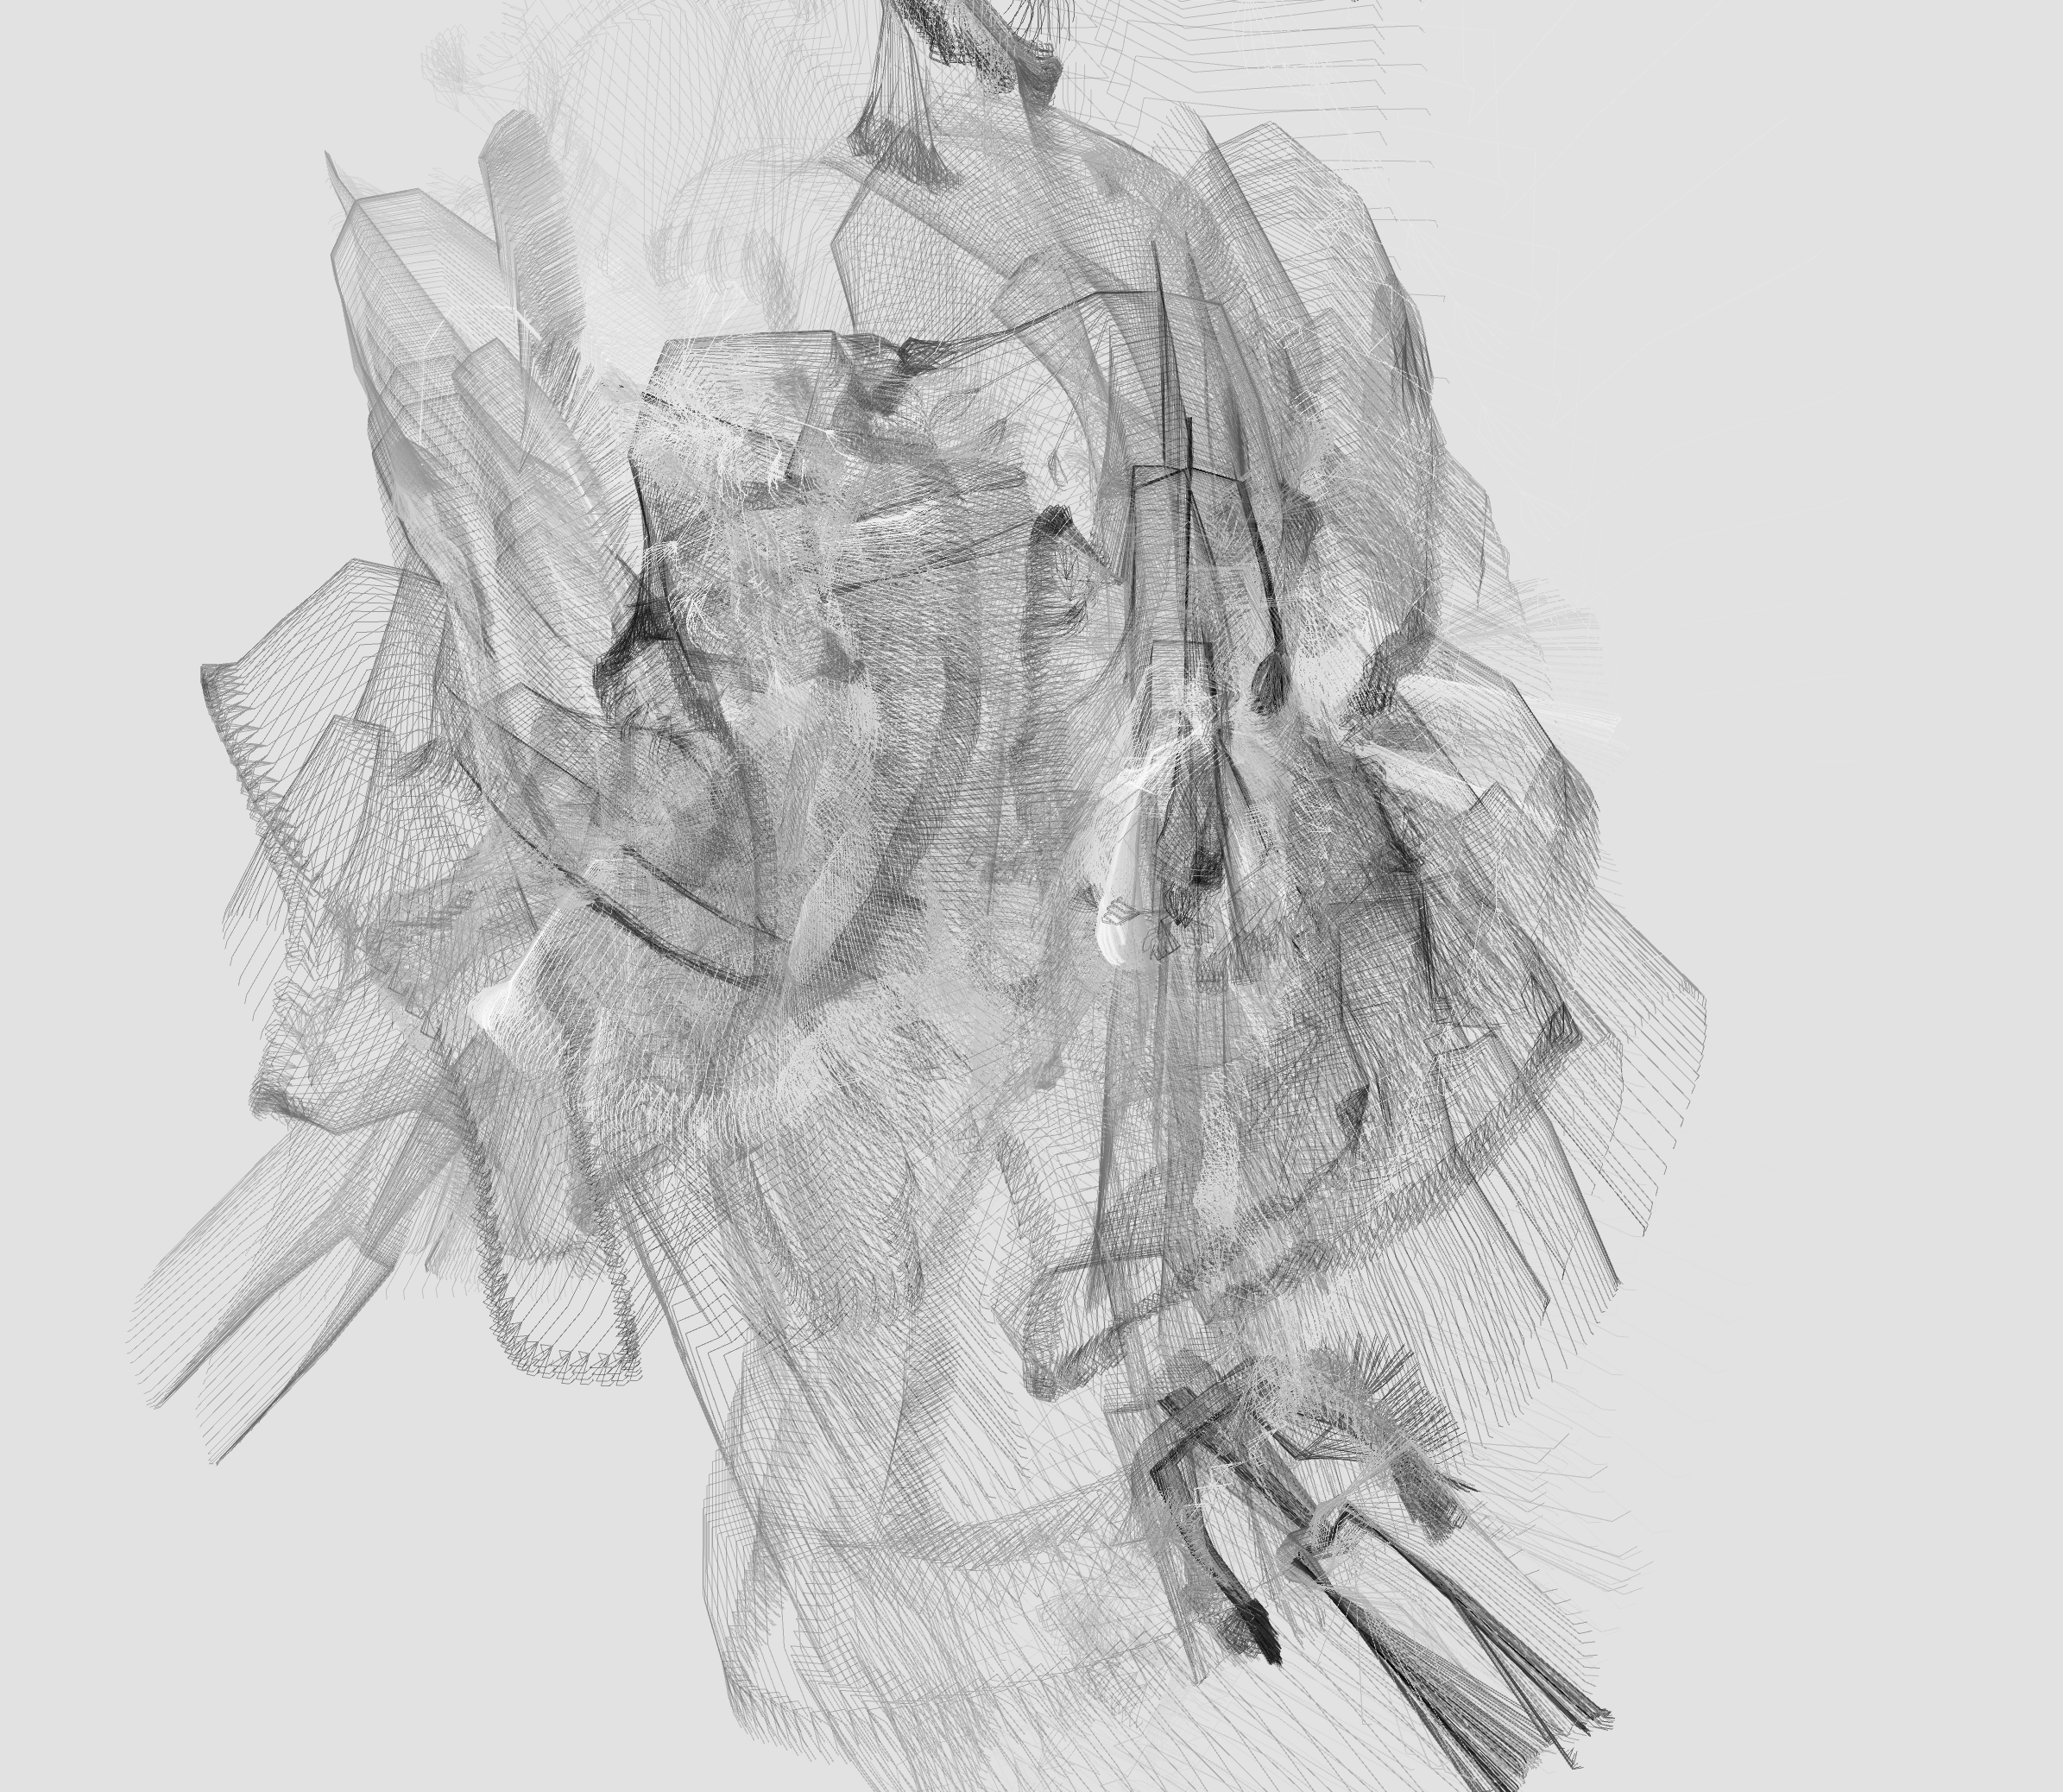
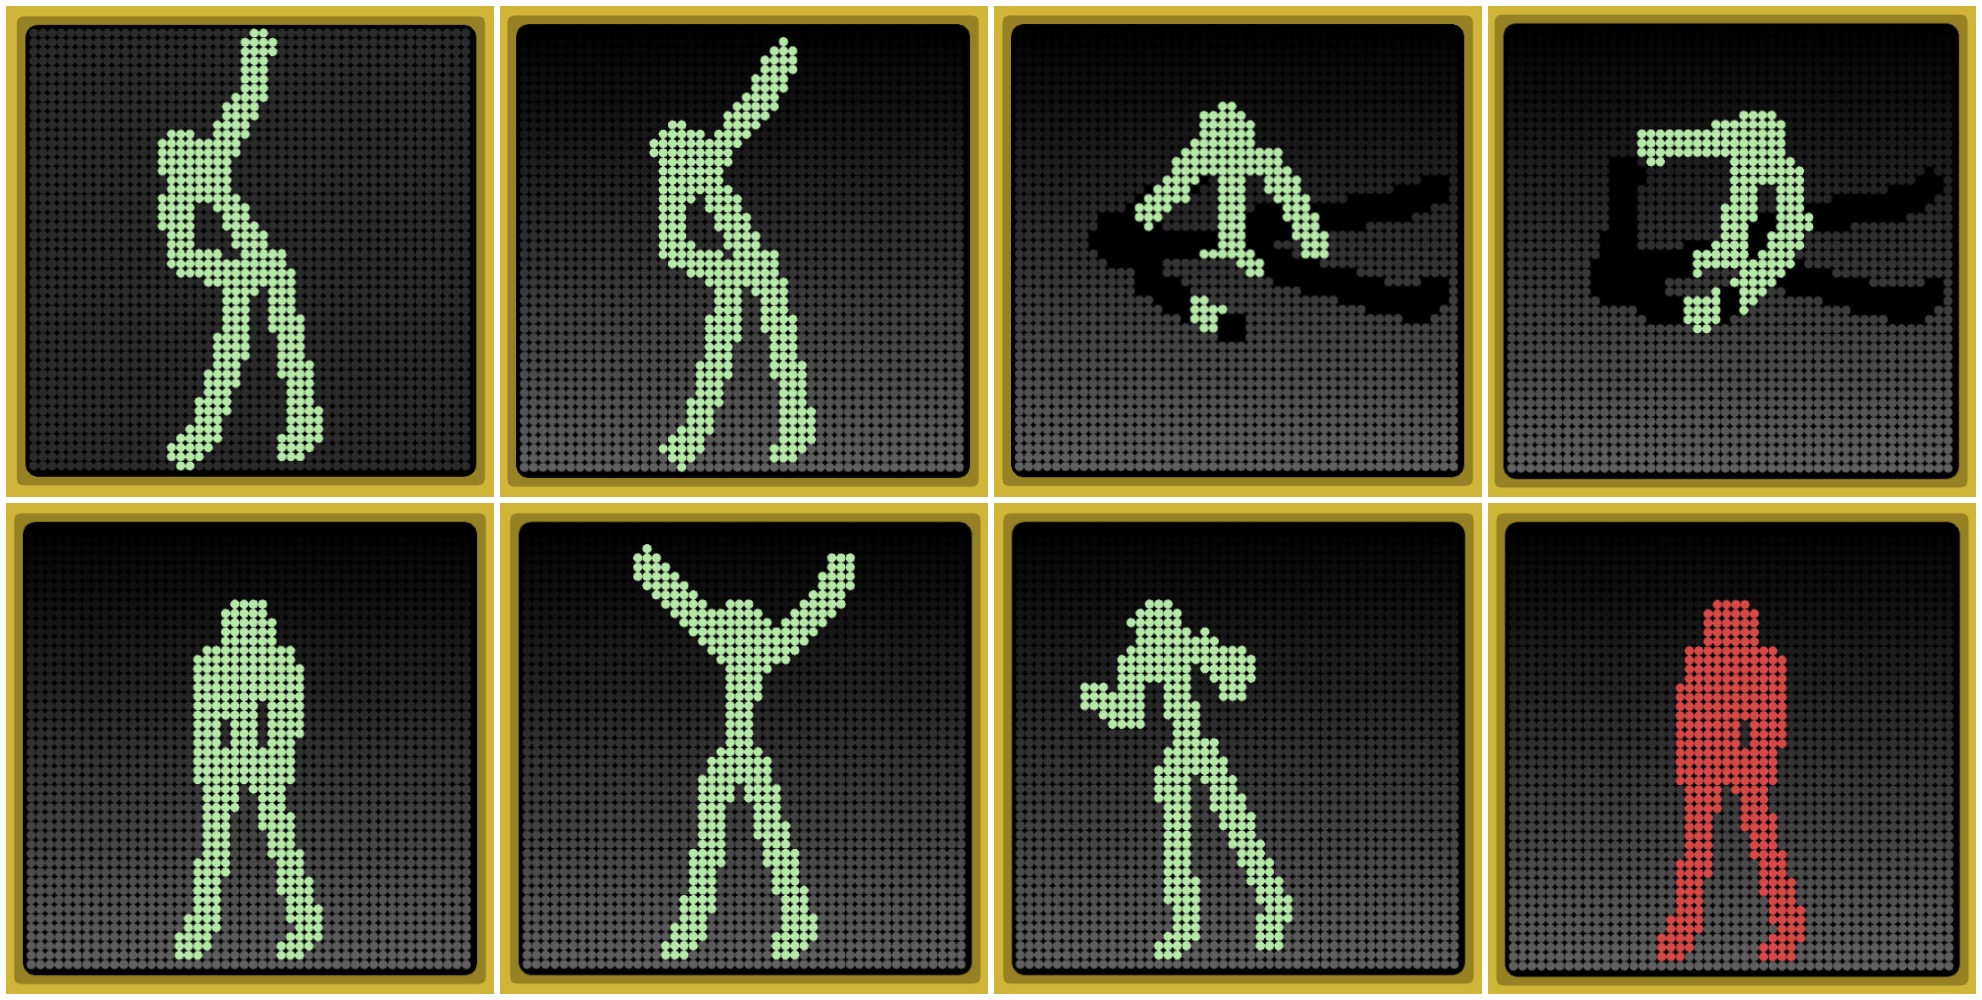
I am most interested in the dynamism of the bodily movements in motion captures, and the idea of abstract human forms composed of objects. I wanted to develop a way to present the abstract impression of humans in energetic motion.
The rotating tapes evolved from the ones in my animated loop assignment. I am fascinated by the way they can depict a form when and only when they’re in motion, and how they’re very flexible and sensitive to movement. So I decided to push on these concepts.
There are two layers of tapes around the bodies. The first, more densely populated, is related more closely to the human form, while the second respond mostly to the human motion. Therefore, when the actors are waving their hands crazily, or kicking and jumping, the second layer of tapes will fly around wildly exaggerating their movements, while the first layer still sticks closely to the bodies outlining their forms.
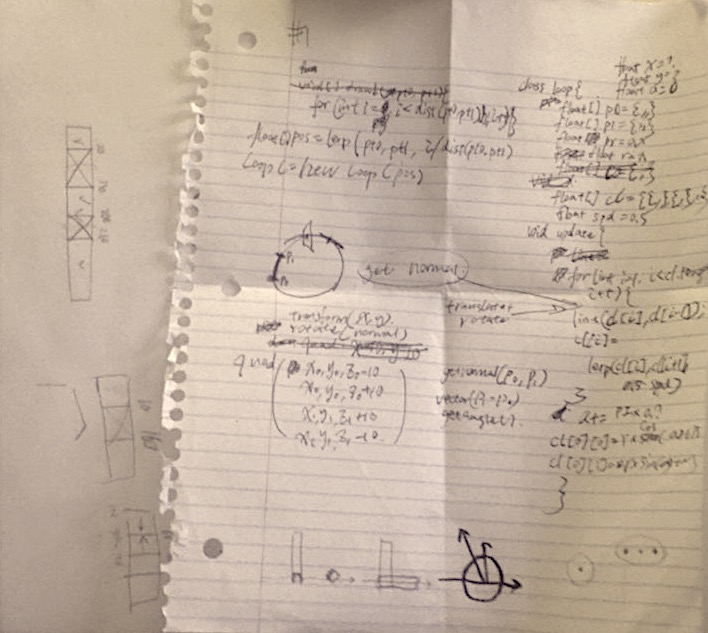
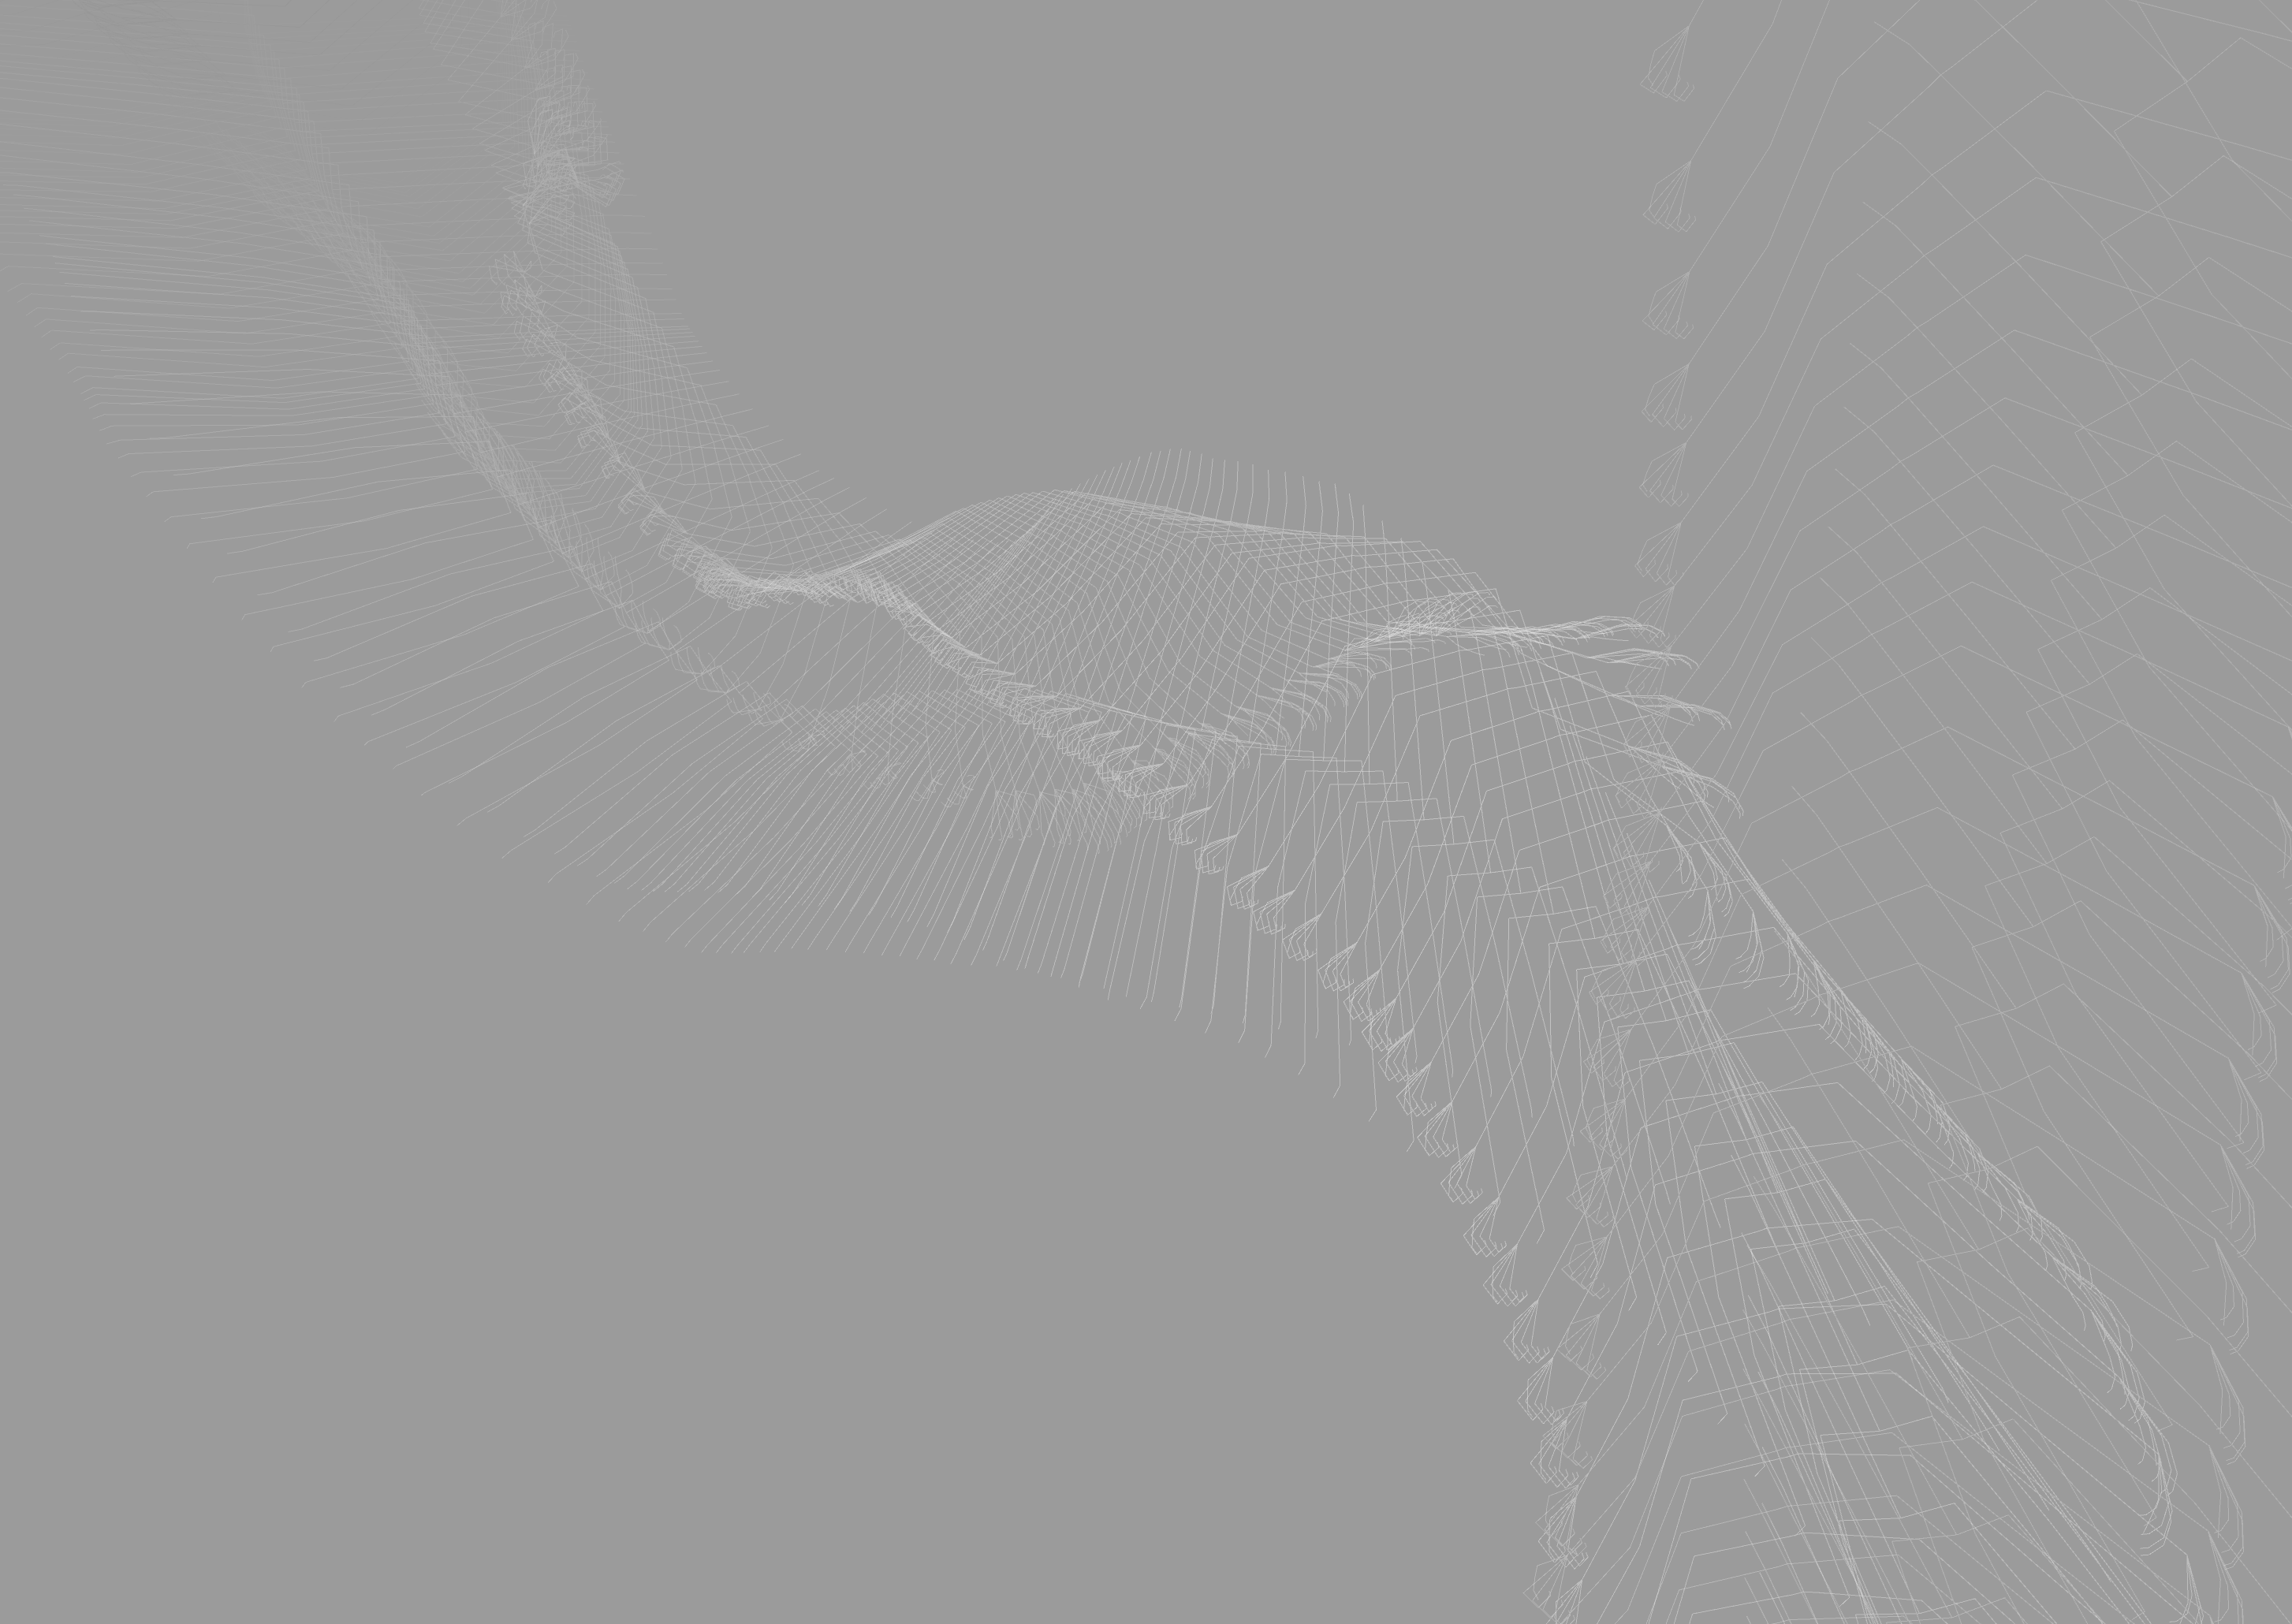
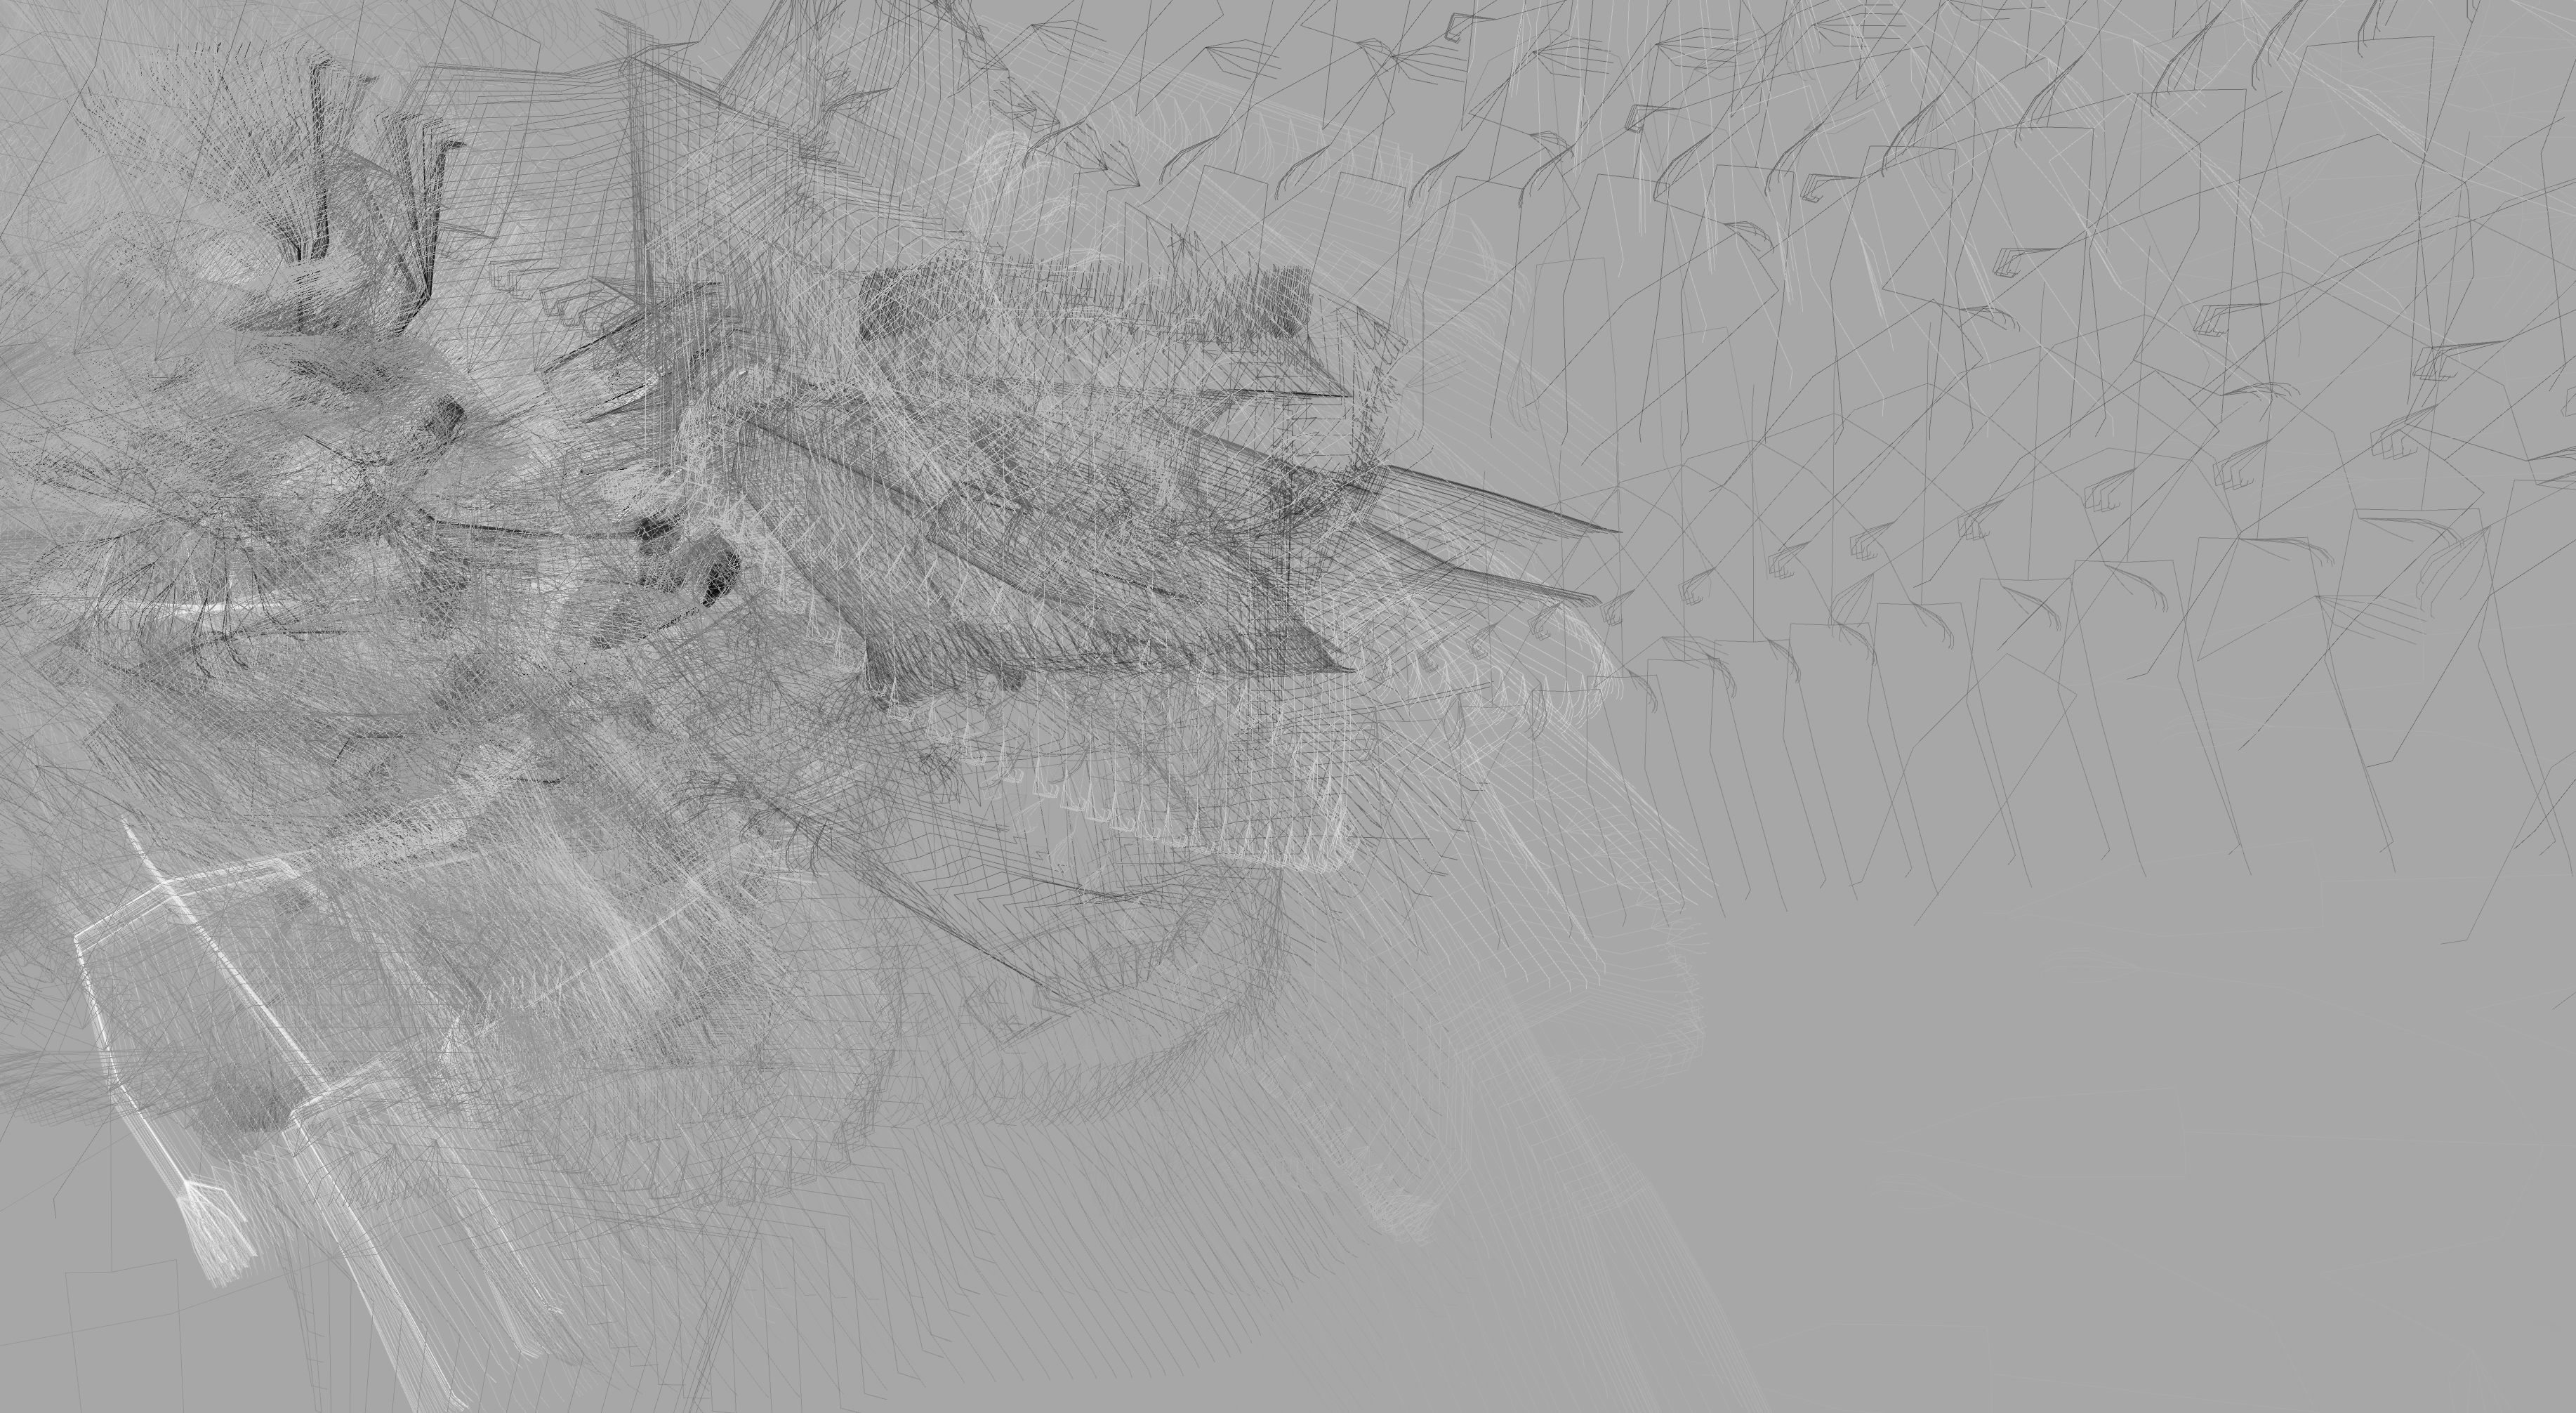
To achieve this, I first calculate a series of evenly spaced points on the skeleton from the motion capture data. These serves as the centers of rotation for the tapes. Then I figured out the directions of the bones at these points, which will be the normals of the planes of rotation for the tapes. I also had the last information stored, so I can know how much things moved since last frame.
After this, through trigonometry, translation and rotation, I can draw each of the segments which makes up a tape that rotates over time.
Since I received comments about how the tapes in my animated loop assignment had questionable colors, I decided to develop a better color scheme for this one.
At a single frame, for either of the two layers of tapes, the colors mainly consists of 3 different shades of the same hue, and one accented color. The colors for the second layer neighbor those of the first layer. When in motion, every colors shifts the same direction in hue. I then wrote a function to redistribute the hues on the color wheel, based on my discovery that some hues looks nicer than others on the tapes.
I used the Mocap data from Perfume, since I found that their data has the most decent quality when compared to others I can find on internet. But I really wonder what my program would look like when visualizing in real time.
BvhParser parserA = new BvhParser();
BvhParser parserA = new BvhParser();
PBvh[] bvhs = new PBvh[3];
Loop[] loops = new Loop[512];

int dmode = 0;

int[][] palette1 = new int[][]{{0,100,80},{5,100,60},{0,100,40},{30,100,80}};
int[][] palette2= new int[][]{{45,17,95},{48,50,80},{60,50,80},{60,20,100}};


int bettercolor(int c0){
  if ( c0 < 120){
    return floor(lerp(0,50,c0/120.0));
  }else if (c0 < 170){
    return floor(lerp(50,170,(c0-120.0)/50.0));
  }else if (c0 < 230){
    return floor(lerp(170,200,(c0-170.0)/60.0));
  }else if (c0 < 260){
    return floor(lerp(200,260,(c0-230.0)/30.0));
  }
  return c0;
}


float[] lerpcoord(float[] p0, float[] p1, float r){
  return new float[]{
    lerp(p0[0],p1[0],r),
    lerp(p0[1],p1[1],r),
    lerp(p0[2],p1[2],r)
  };
}
float dist3d(float[] p0, float[] p1){
  return sqrt(
    sq(p0[0]-p1[0])+
    sq(p0[1]-p1[1])+
    sq(p0[2]-p1[2])
  );

}


class Loop{
  float x0;
  float y0;
  float z0;
  float[] lxyz = new float[3];
  float a;
  float w = 4;
  float[] dirv = new float[3];
  float[] dirv2 = new float[3];
  float r;
  float r1;
  float r2;
  float rp1=1;
  float rp2=1;
  float[][] cl = new float[32][4];
  int cll = 16;
  float spd = 0.1;
  int id;
  int[] col = new int[3];
  public Loop(float x,float y,float z){
    this.x0 = x;
    this.y0 = y;
    this.z0 = z;
    id = floor(random(100000));
    a = random(PI*2);
  }
  public void update(){

    r1 = lerp(r1,dist3d(new float[]{x0,y0,z0},lxyz),0.25);
    r2 = noise(id,frameCount*0.1)*10;

    r = r1*rp1+r2*rp2;
    a+=PI*spd;

    dirv2 = new float[]{x0-lxyz[0],y0-lxyz[1],z0-lxyz[2]};

    cl[0][0] = r*cos(a);
    cl[0][1] = r*sin(a);

    for (int i = 1; i < cll; i++){
      pushMatrix();
      translate(x0,y0,z0);
      rotateX(atan2(dirv[2],dirv[1]));
      rotateZ(atan2(dirv[1],dirv[0]));

      //translate(10,0,0);
      //box(20,5,5);


      cl[i][0] = r*cos(a+i*0.05*PI);
      cl[i][1] = r*sin(a+i*0.05*PI);
      //cl[i] = lerpcoord(cl[i],cl[i-1],spd);

      rotateY(PI/2);
      noStroke();
      fill(col[0],col[1],col[2]);
      beginShape();
        vertex(cl[i][0],cl[i][1],-w/2);
        vertex(cl[i][0],cl[i][1],w/2);
        vertex(cl[i-1][0],cl[i-1][1],w/2);
        vertex(cl[i-1][0],cl[i-1][1],-w/2);
      endShape();
      if (dmode == 0){
        stroke(0,0,10);
      }
      line(cl[i][0],cl[i][1],-w/2,cl[i-1][0],cl[i-1][1],-w/2);
      line(cl[i][0],cl[i][1],w/2,cl[i-1][0],cl[i-1][1],w/2);
      //line(cl[i][0],cl[i][1],cl[i][2],cl[i-1][0],cl[i-1][1],cl[i-1][2]);

      popMatrix();
    }

    a += PI*0.1;

  }
}


public void setup()
{
  size( 1200, 720, P3D );
  background( 0 );
  noStroke();
  frameRate( 30 );

  bvhs[0] = new PBvh( loadStrings( "aachan.bvh" ) );
  bvhs[1] = new PBvh( loadStrings( "nocchi.bvh" ) );
  bvhs[2] = new PBvh( loadStrings( "kashiyuka.bvh" ) );
  for (int i = 0; i < loops.length; i++){ loops[i] = new Loop(0.0,0.0,0.0); } if (dmode == 1){ palette1 = new int[][]{{255,255,255}}; palette2 = new int[][]{{100,255,255}}; }else{ colorMode(HSB,360,100,100); } //noLoop(); } public void draw() { background(0,0,10); //camera float rr = 600; float ra = PI/2.75; camera(width/2+rr*cos(ra),height/2,rr*sin(ra),width/2,height/2,0,0,1,0); pushMatrix(); translate( width/2+50, height/2+150, 0); scale(-2, -2, -2); if (dmode > 0){
    background(230);
    directionalLight(160,160,160, 0.5, -1, 0.5);
    //pointLight(255,255,255,0,-300,-200);
    //pointLight(255,255,255,0,-300,0);
    ambientLight(160,160,160);
    //shininess(5.0);
    fill(250);
    pushMatrix();
    //rotateX(frameCount*0.1);
    box(500,10,500);
    popMatrix();

  }
  //model
  int j = 0;
  int e = 0;
  for (int i = 0; i < bvhs.length; i++){
    bvhs[i].update( 2000+frameCount*25 );

    for( BvhBone b : bvhs[i].parser.getBones())
    {


      if (b.getParent()!= null){
        float px = b.getParent().absPos.x;
        float py = b.getParent().absPos.y;
        float pz = b.getParent().absPos.z;

        float[] p1 =  new float[]{b.absPos.x,b.absPos.y,b.absPos.z};
        float[] p0 = new float[]{px,py,pz};
        float d =  dist3d(p0,p1);

        for (float k = 0; k < d; k+= 4){

          float[] c = lerpcoord(p0,p1,k/d);
          loops[j].lxyz = new float[]{loops[j].x0,loops[j].y0,loops[j].z0};
          loops[j].x0 = c[0];
          loops[j].y0 = c[1];
          loops[j].z0 = c[2];

          loops[j].rp1 = 0.5;
          loops[j].rp2 = 1.7;
          loops[j].dirv = new float[]{ px-b.absPos.x, py-b.absPos.y, pz-b.absPos.z};
          int[] col = palette1[j%palette1.length];
          loops[j].col[0] = bettercolor(floor(col[0]+320+frameCount*0.15)%360);
          loops[j].col[1] = col[1]; loops[j].col[2] = col[2];
          loops[j].cll = 24;
          j++;
        }
        for (float k = 0; k < d; k+= 100){

          float[] c = lerpcoord(p0,p1,k/d);
          loops[j].lxyz = new float[]{loops[j].x0,loops[j].y0,loops[j].z0};
          loops[j].x0 = c[0];
          loops[j].y0 = c[1];
          loops[j].z0 = c[2];
          loops[j].dirv = new float[]{ px-b.absPos.x, py-b.absPos.y, pz-b.absPos.z};
          loops[j].rp1 = 10;
          loops[j].rp2 = 2;
          int[] col = palette2[j%palette2.length];
          loops[j].col[0] = floor(col[0]+320+frameCount*0.15)%360;
          loops[j].col[1] = col[1]; loops[j].col[2] = col[2];
          loops[j].cll = 24;
          loops[j].cll = 16;
          loops[j].spd = 0.01;
          j++;
        }

        //line(b.absPos.x,b.absPos.y,b.absPos.z,px,py,pz);
      }

      pushMatrix();
      translate(b.absPos.x, b.absPos.y, b.absPos.z);
      fill(0,0,100);
      if (dmode <= 0){rotateY(PI/2-PI/2.75);ellipse(0, 0, 2, 2);}
      popMatrix();
      if (!b.hasChildren())
      {
        pushMatrix();
        translate( b.absEndPos.x, b.absEndPos.y, b.absEndPos.z);
        if (dmode <= 0){
          rotateY(PI/2-PI/2.75);
          ellipse(0,0,5,5);
        }
        popMatrix();
      }
    }
  }

  for (int i = 0; i < j; i++){
    loops[i].update();
  }

  popMatrix();
  //saveFrame("frames/"+nf(frameCount,6)+".png");

}


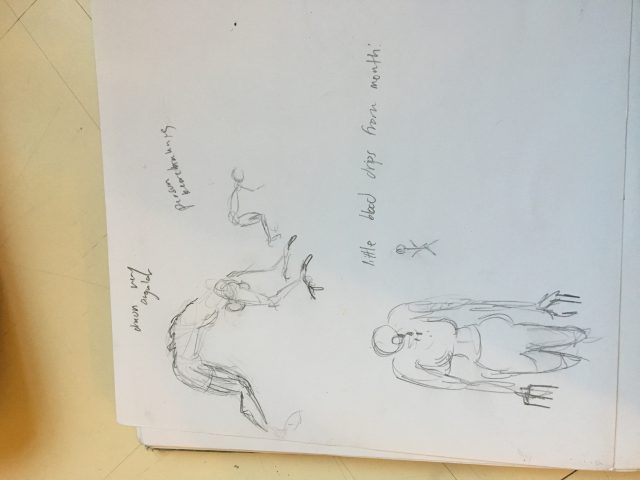 the sketching for the monster
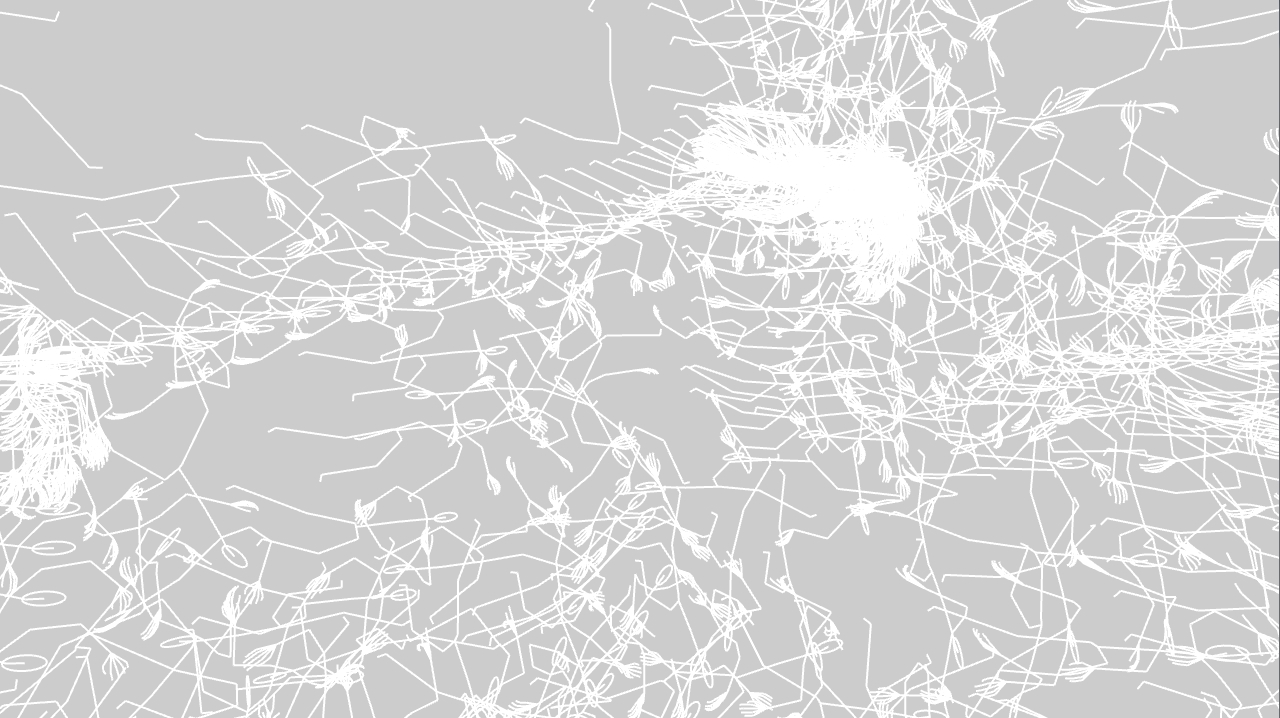
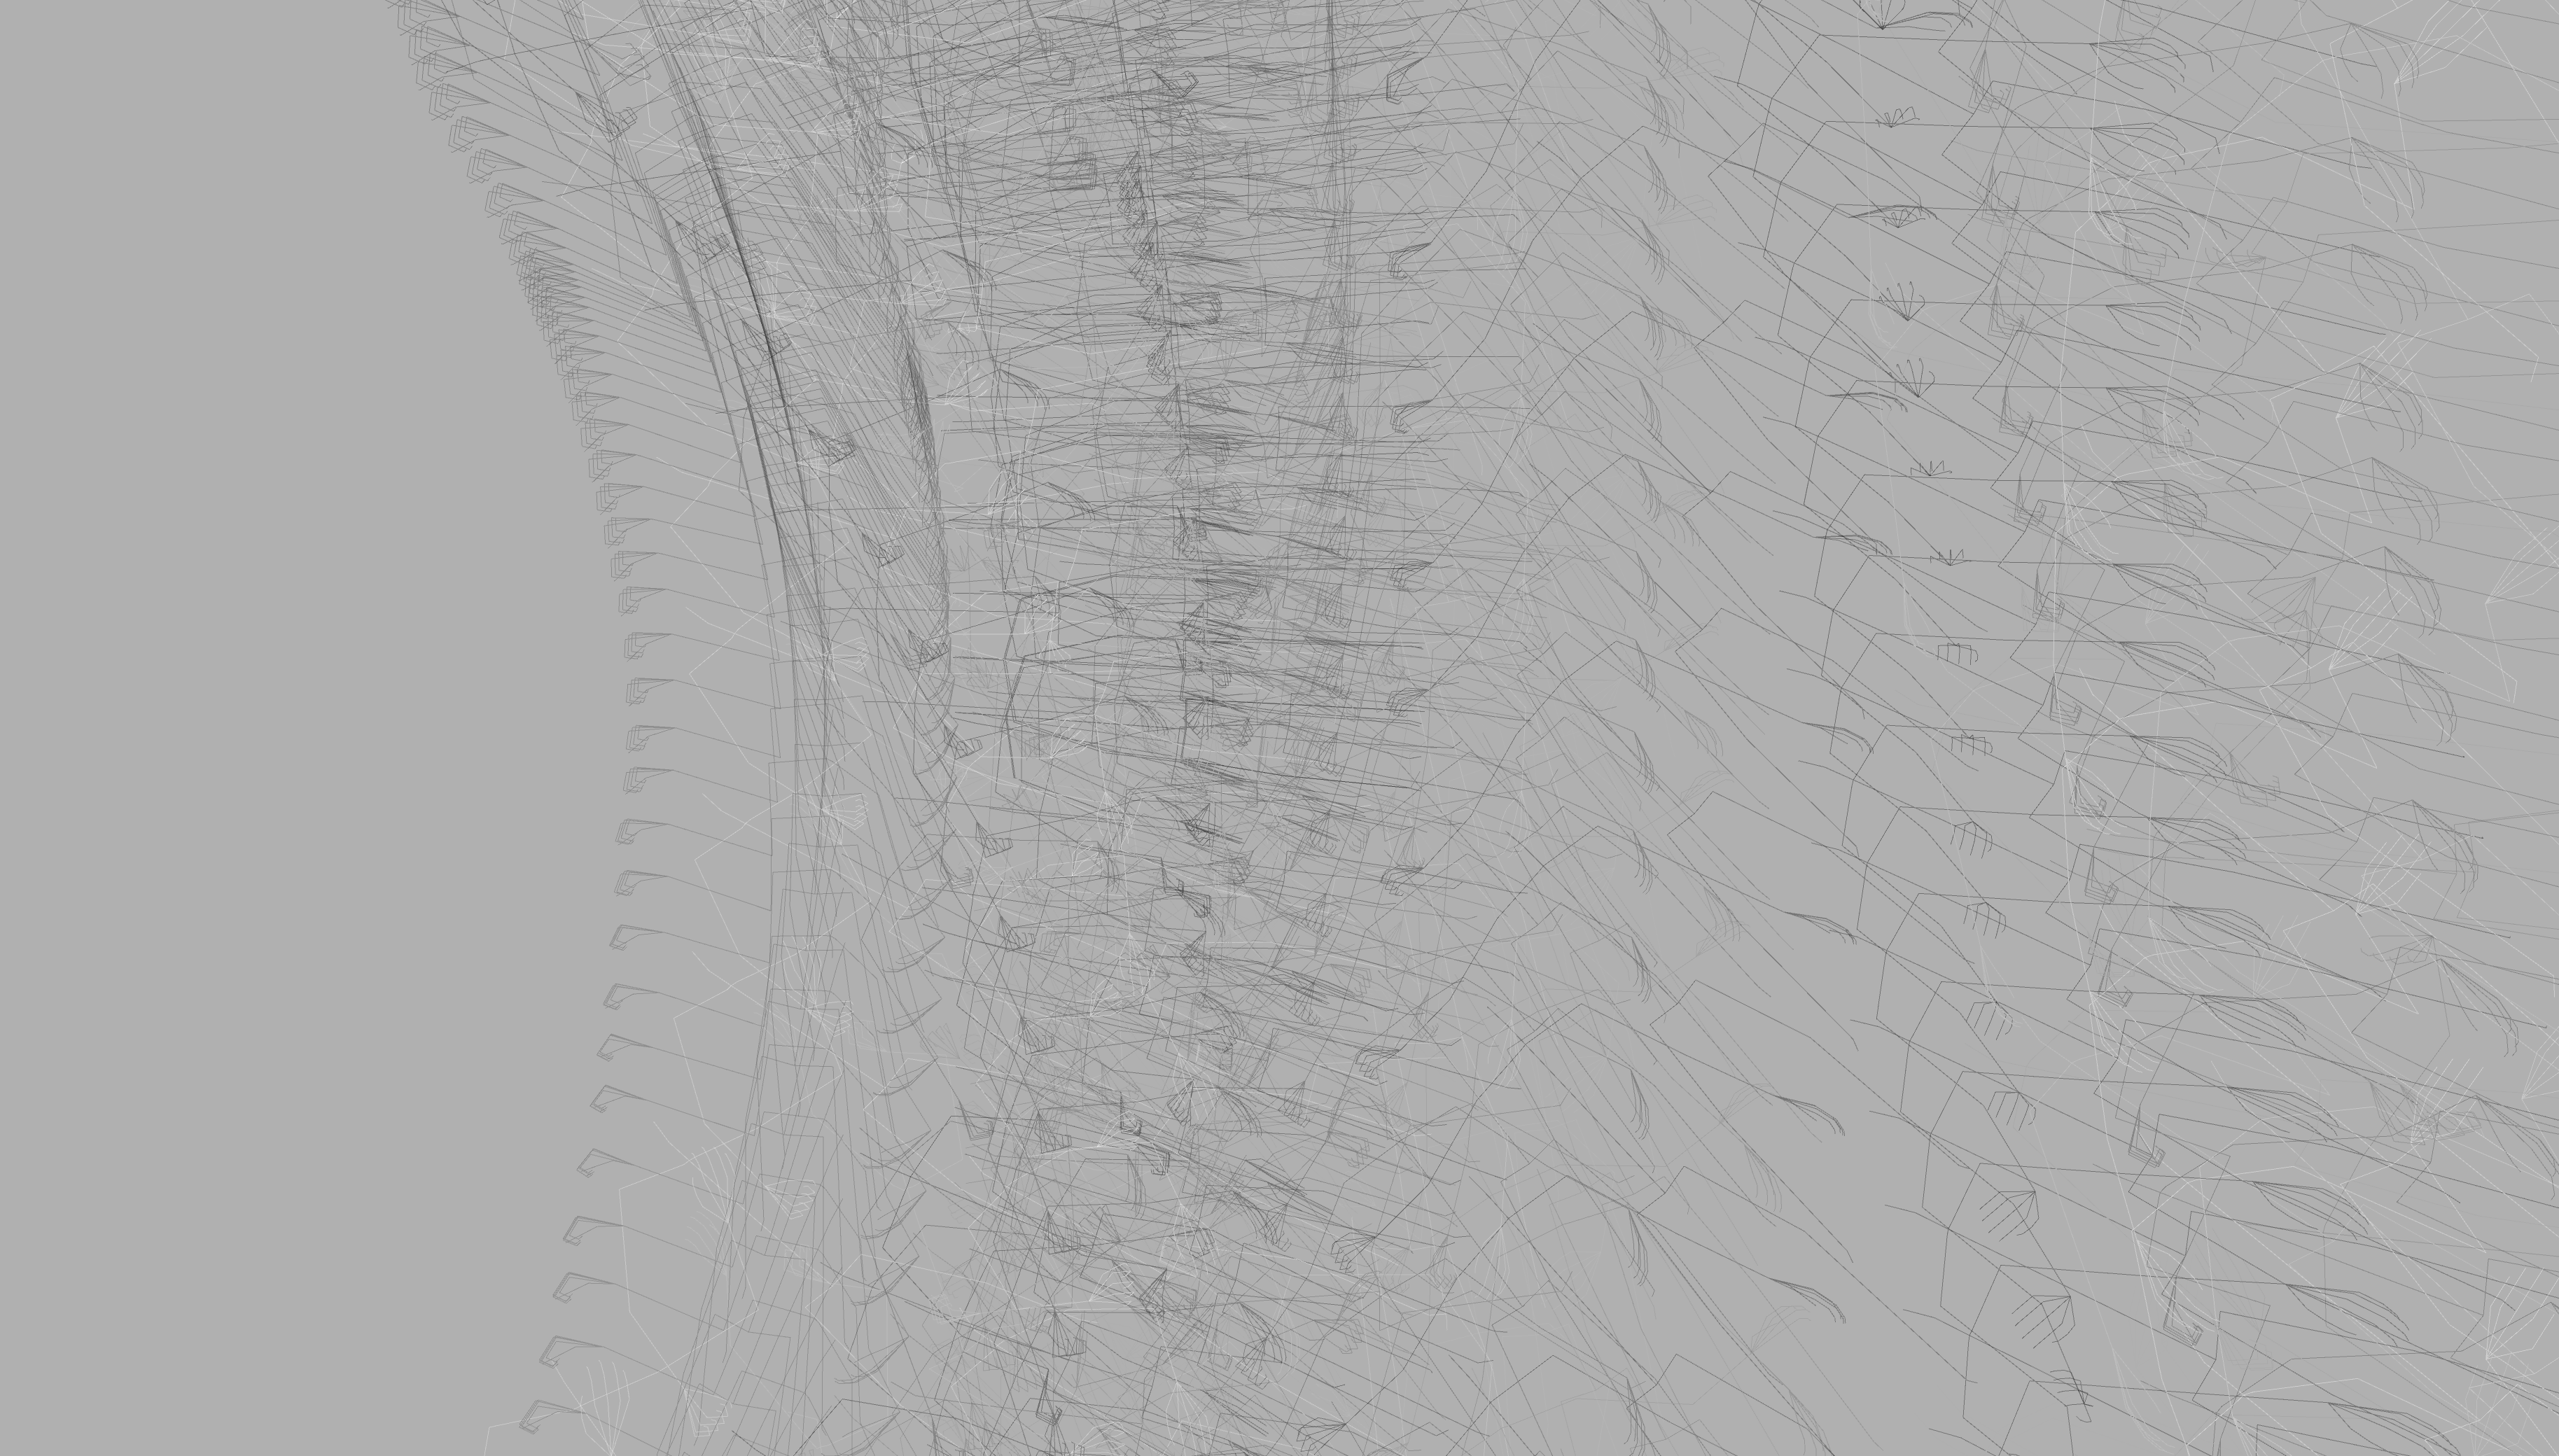
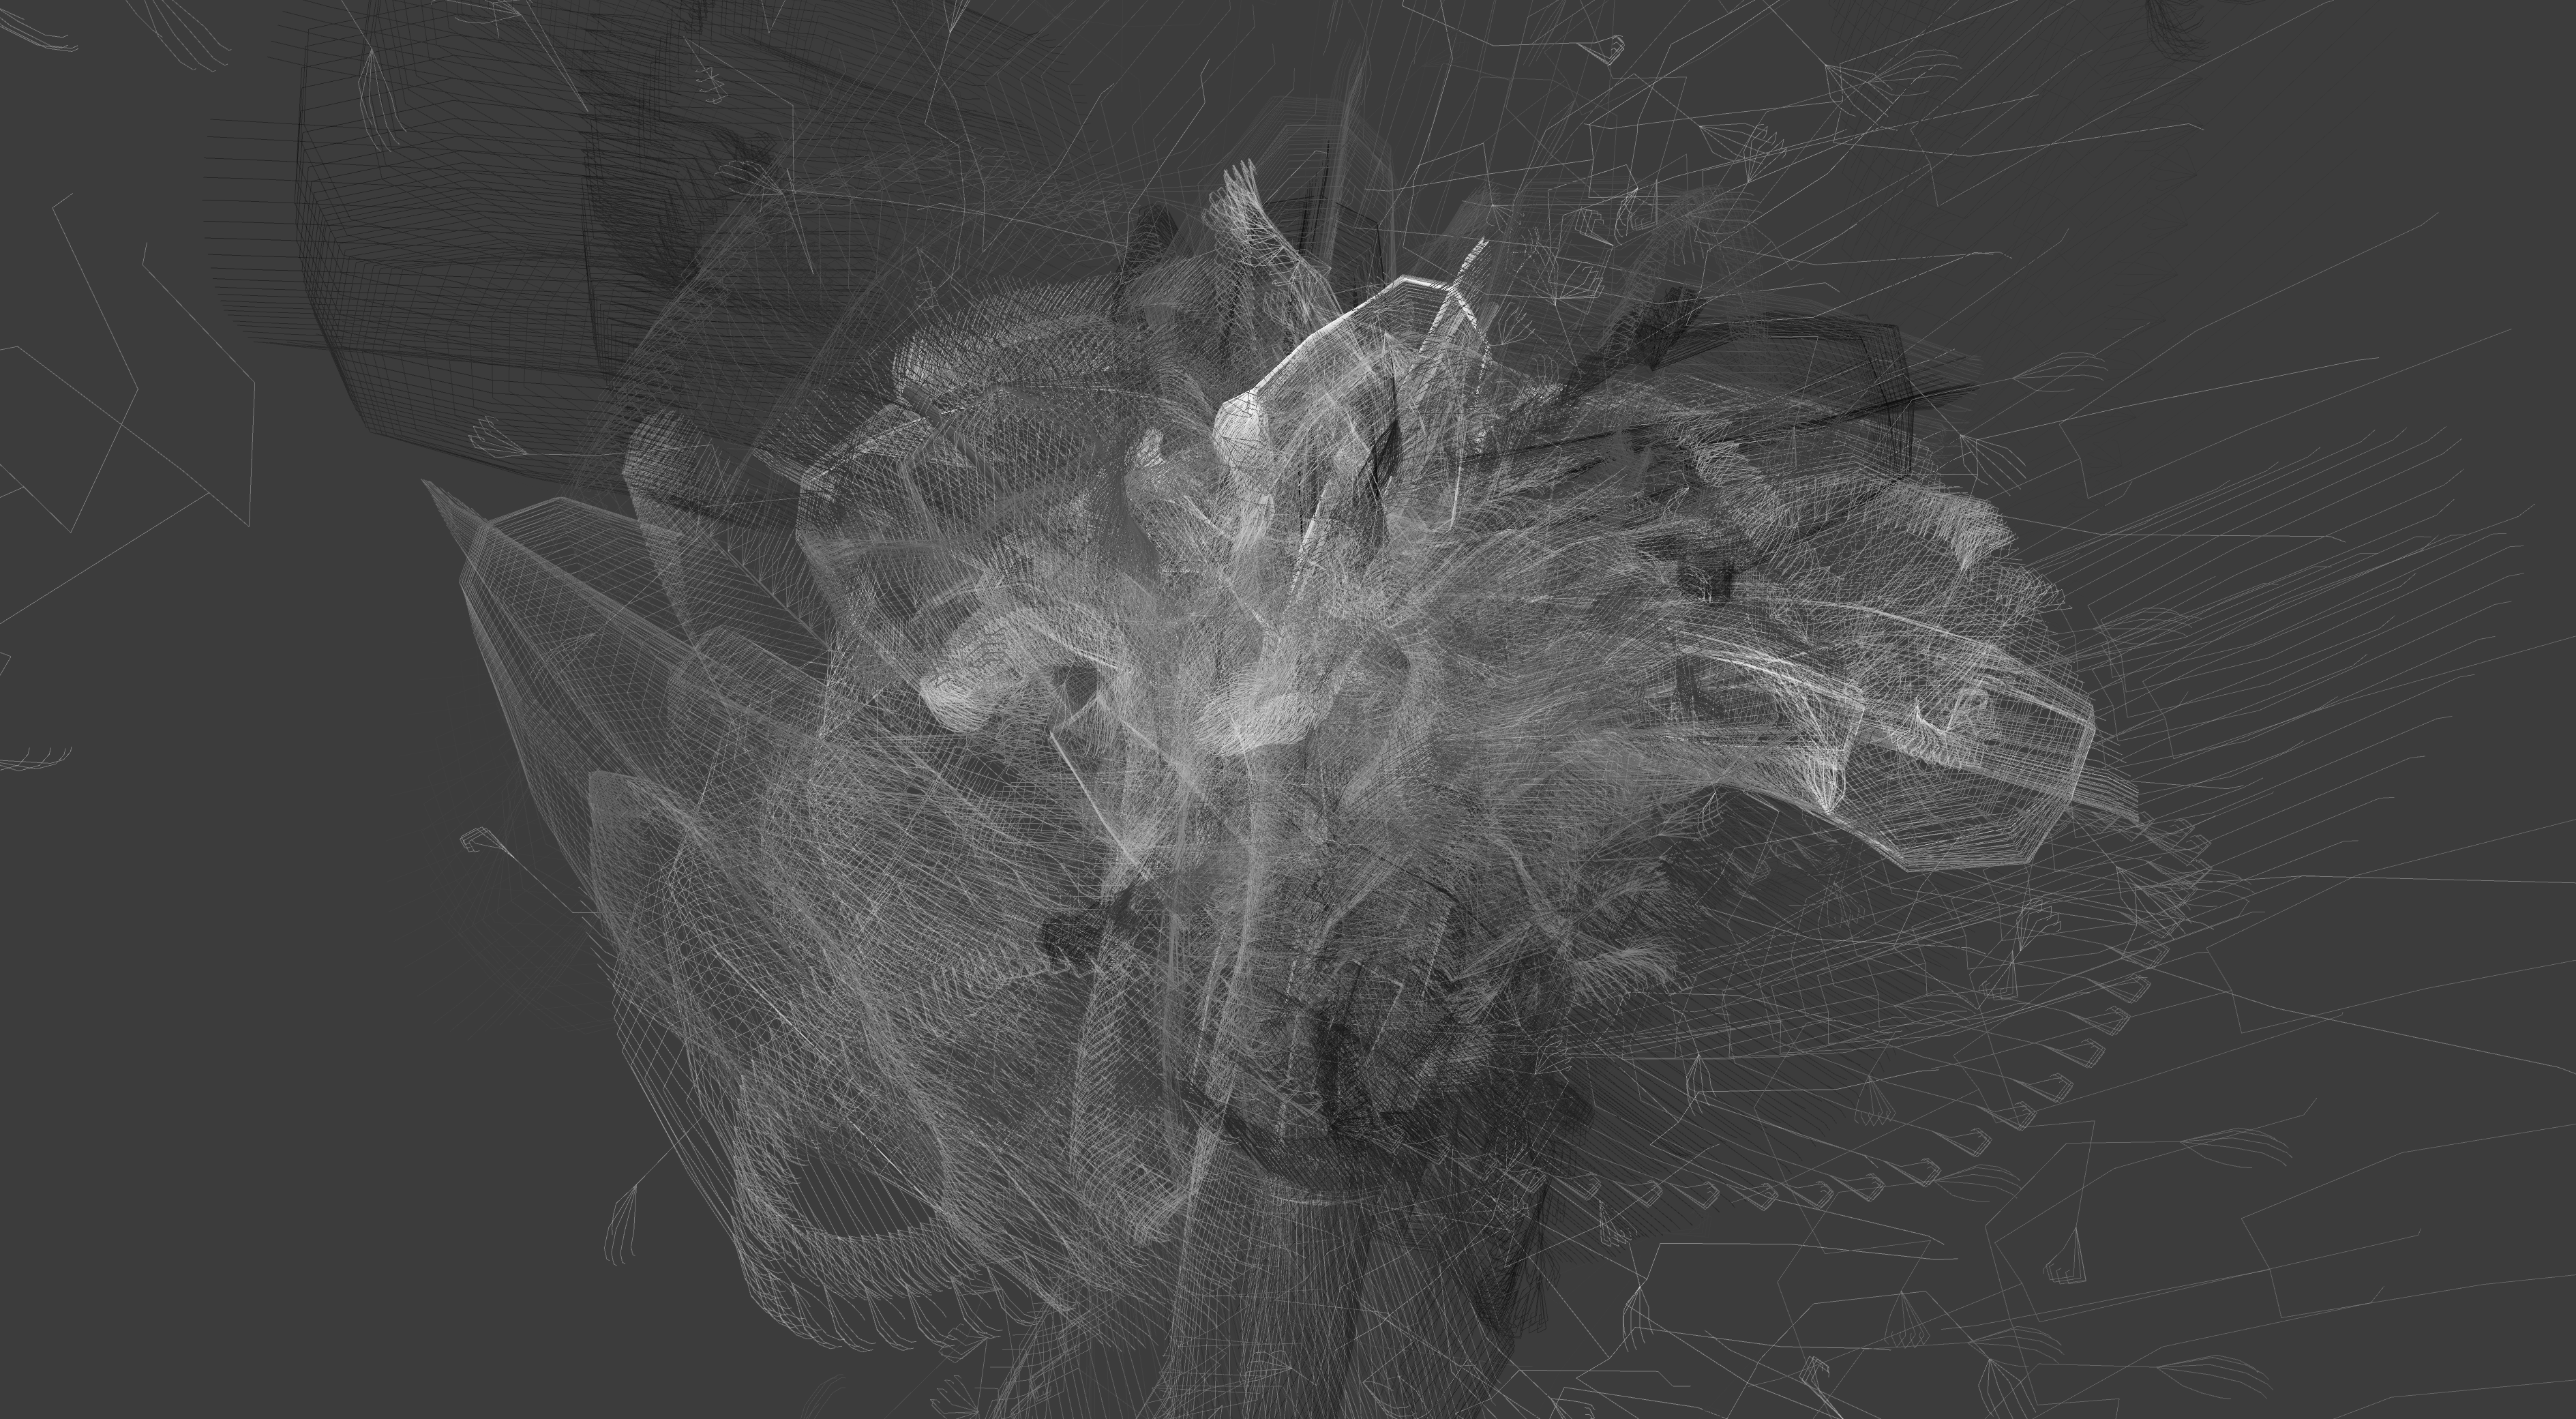
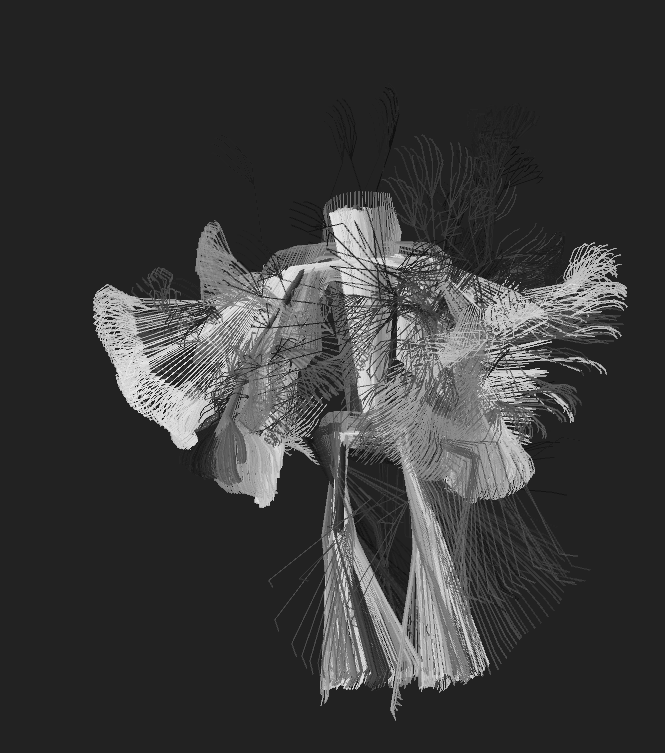
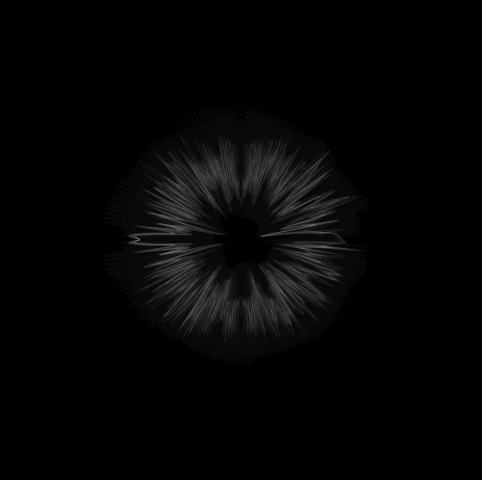
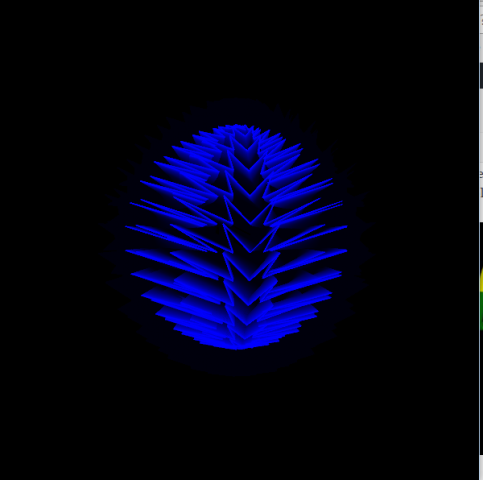 Some of my experiments with Perlin noise to generate forms
 Some of my experiments with Perlin noise to generate forms
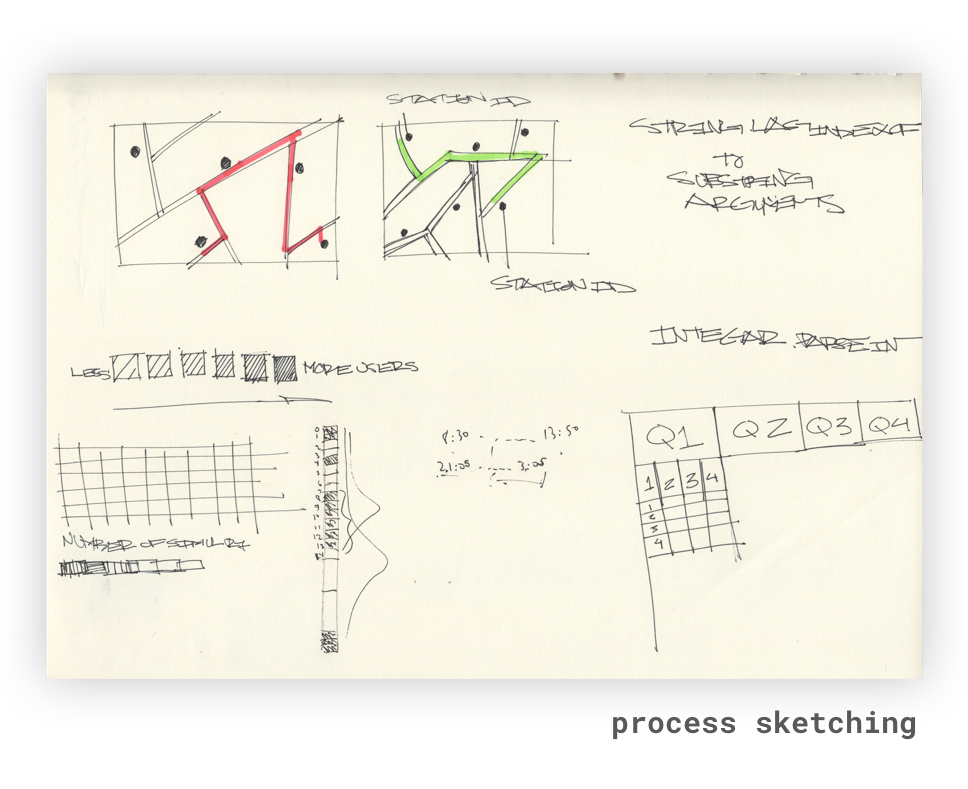
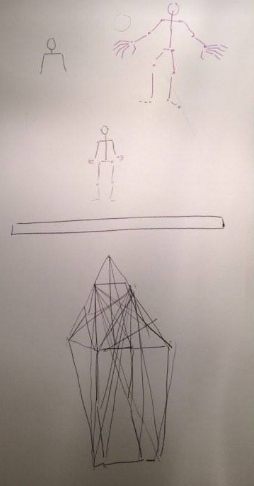
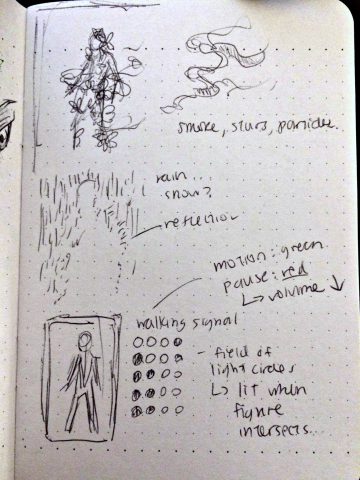
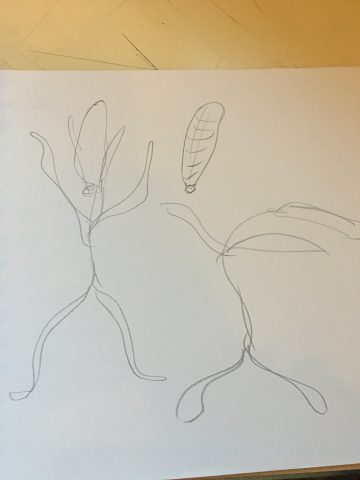 sketches of my ideas
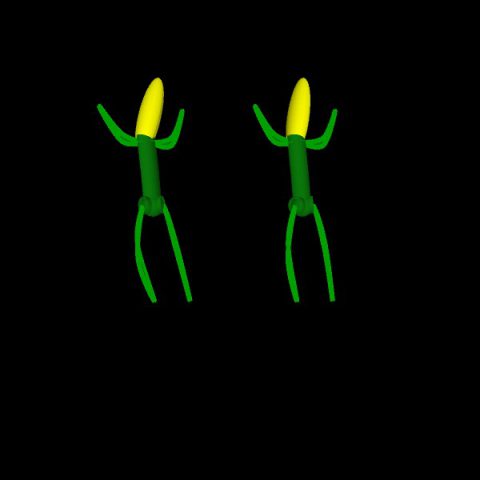
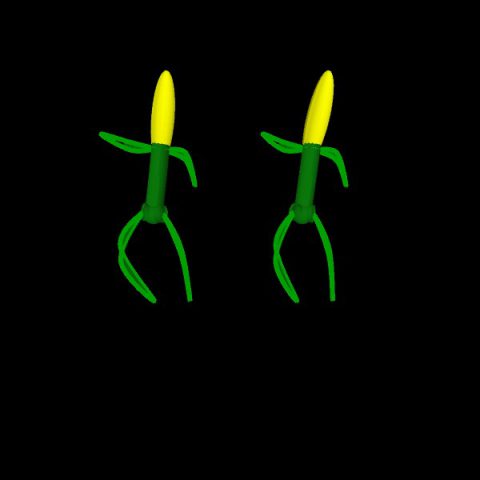
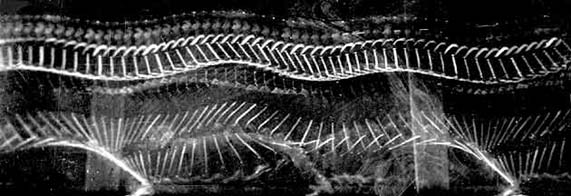
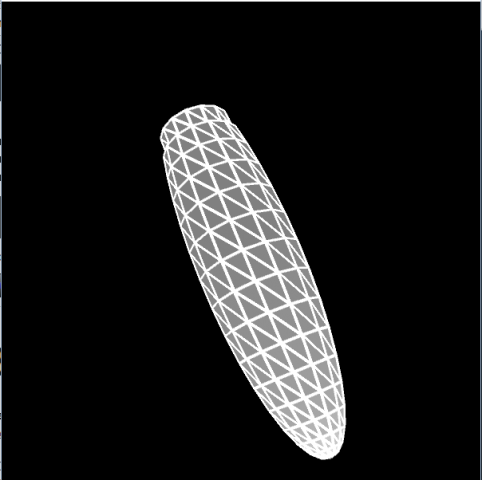 the OG ear of corn