Table of Contents:
- Process
- Technical Details
- Photo & Video Gallery
- Full Code Embed
Process
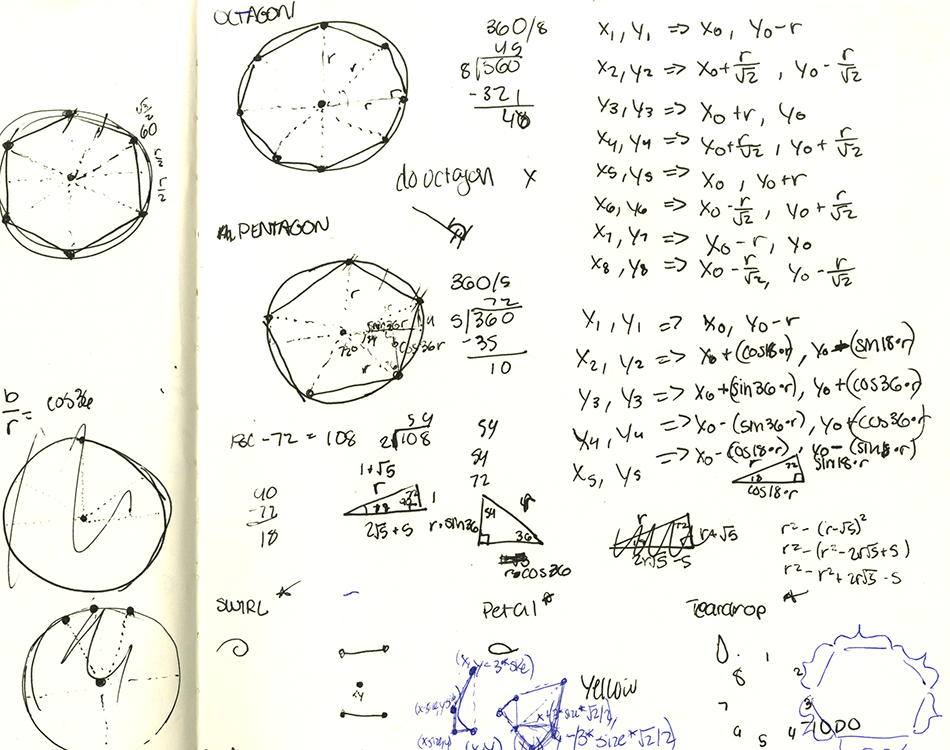
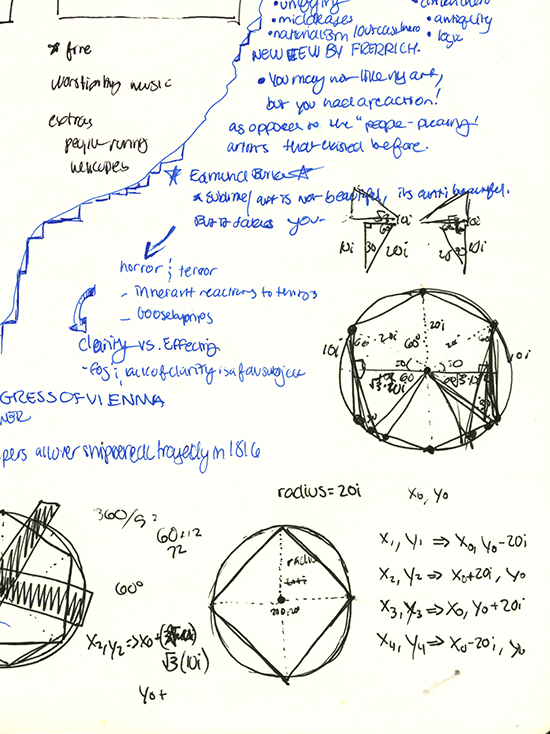
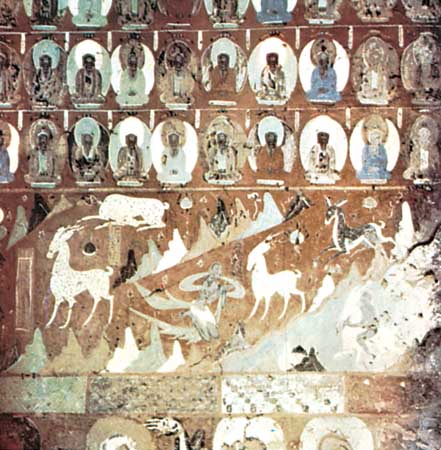
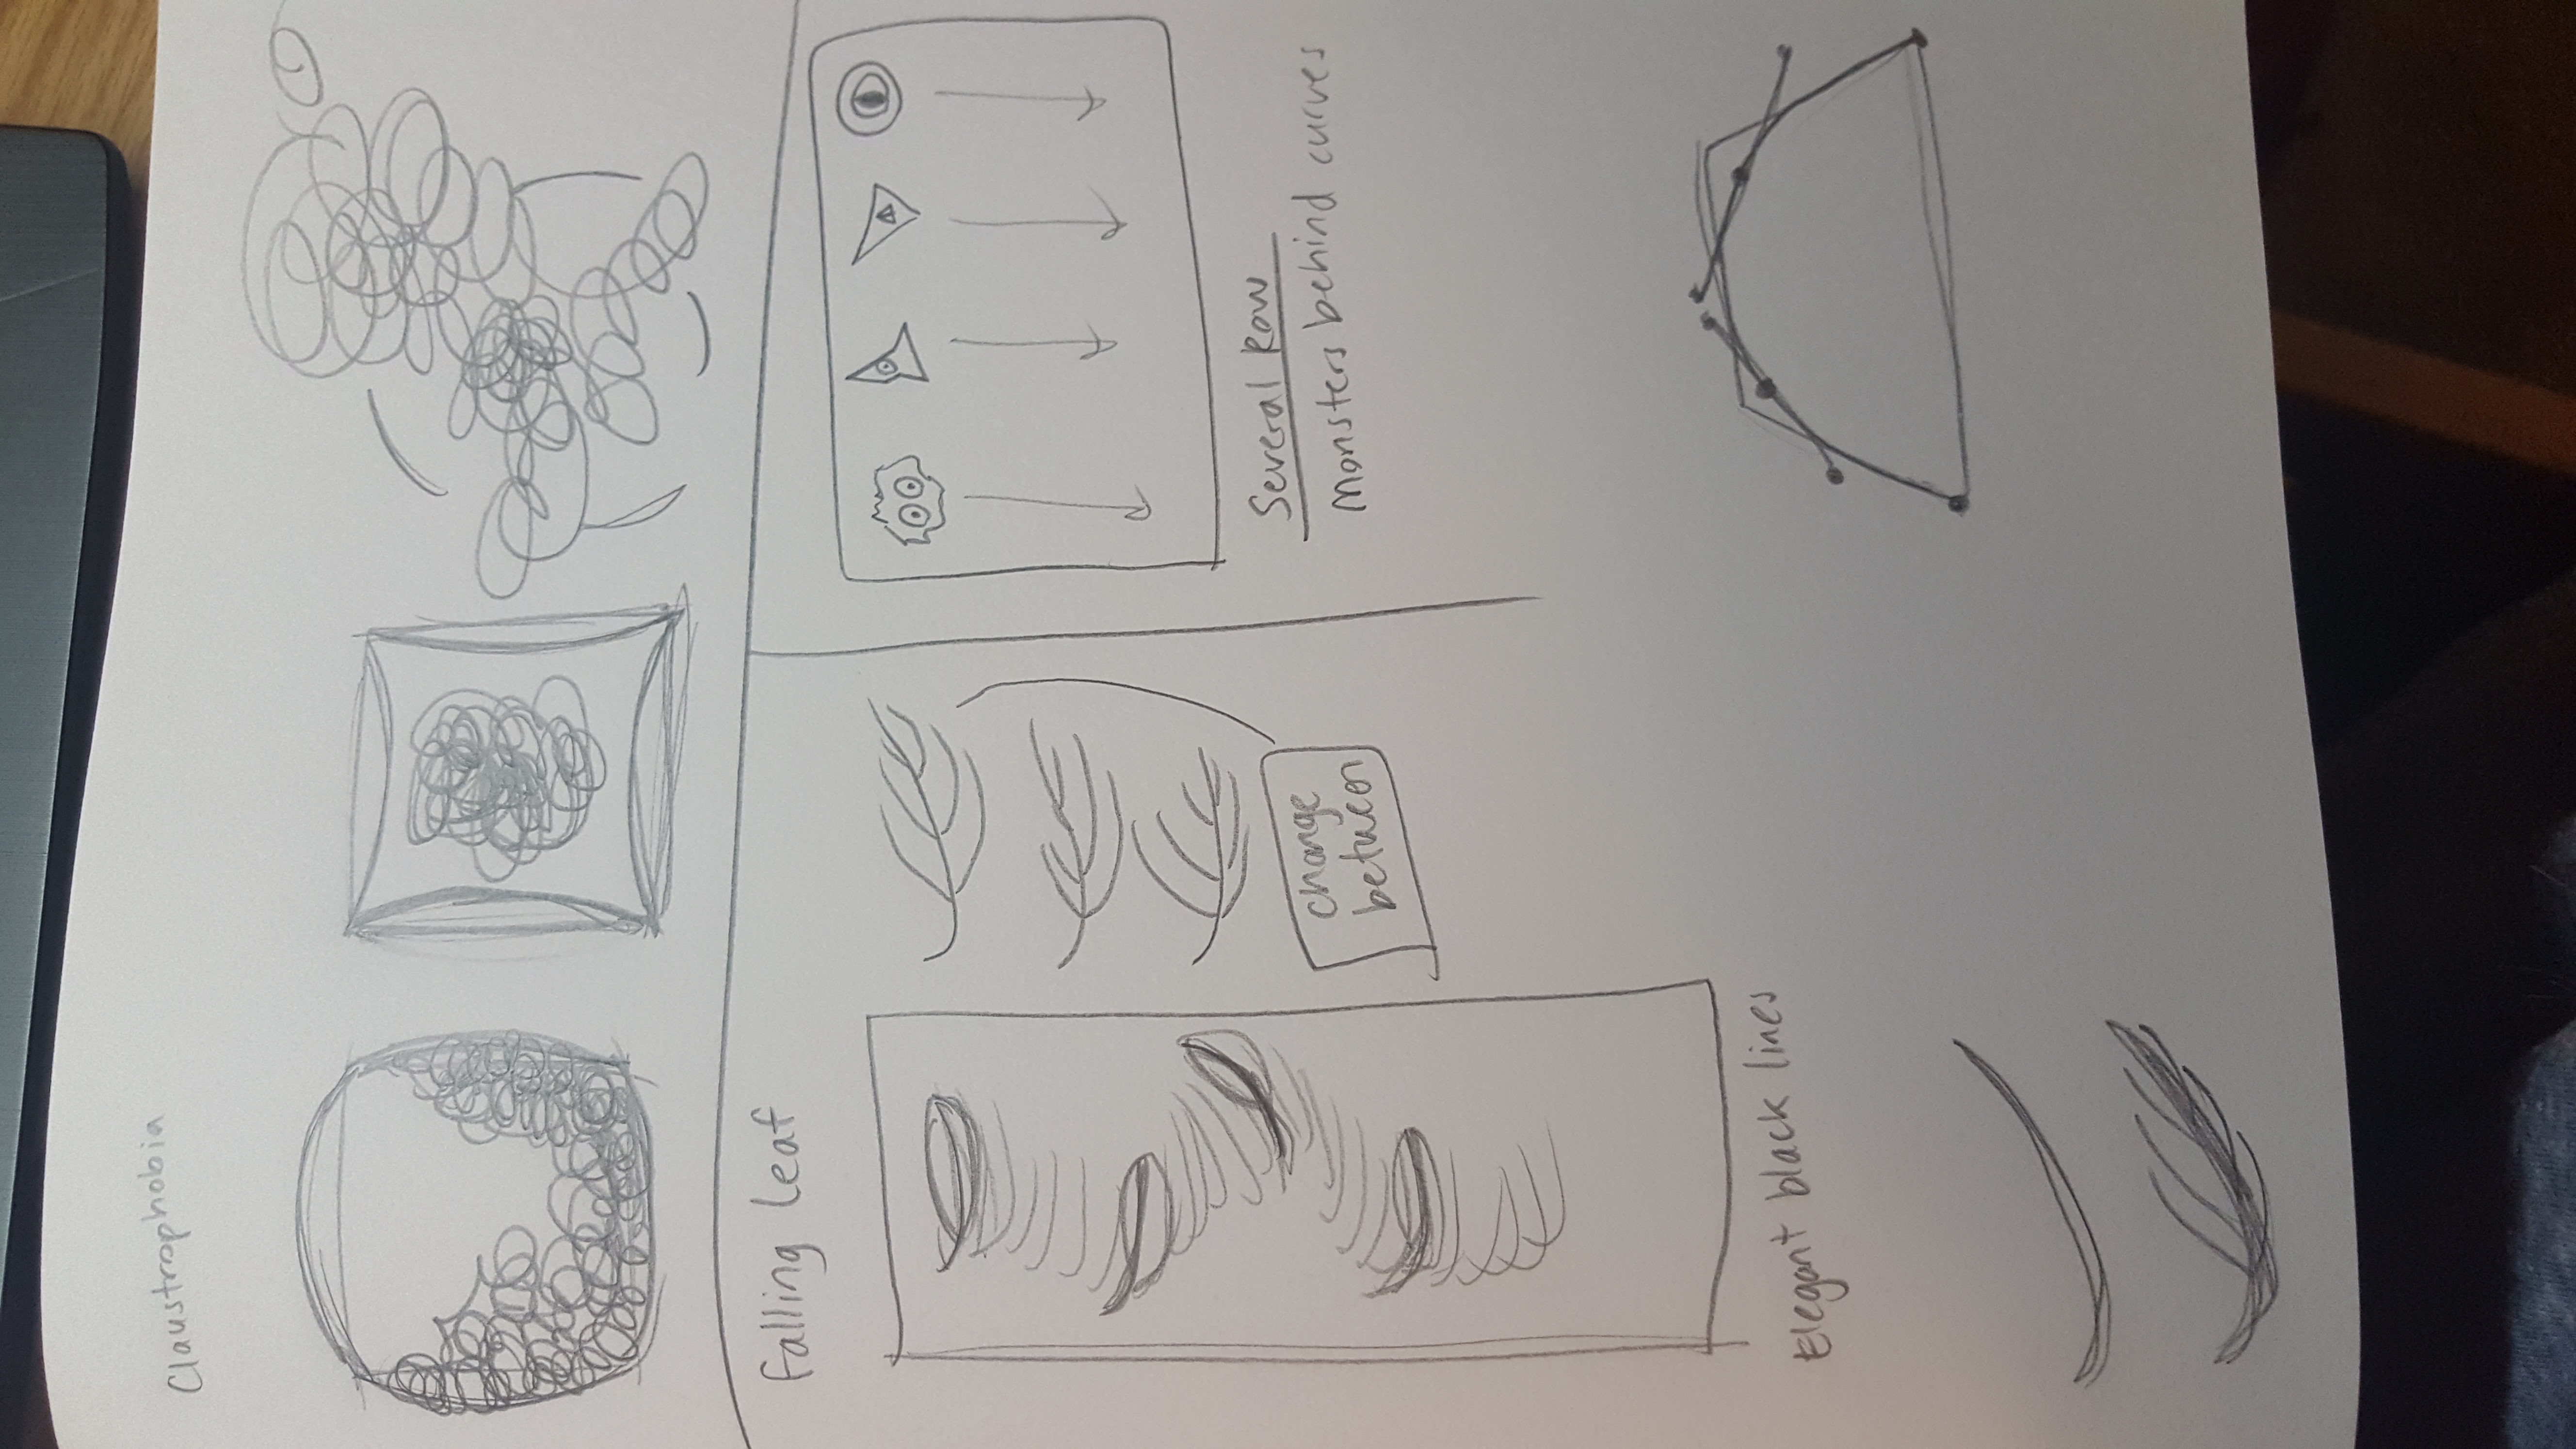
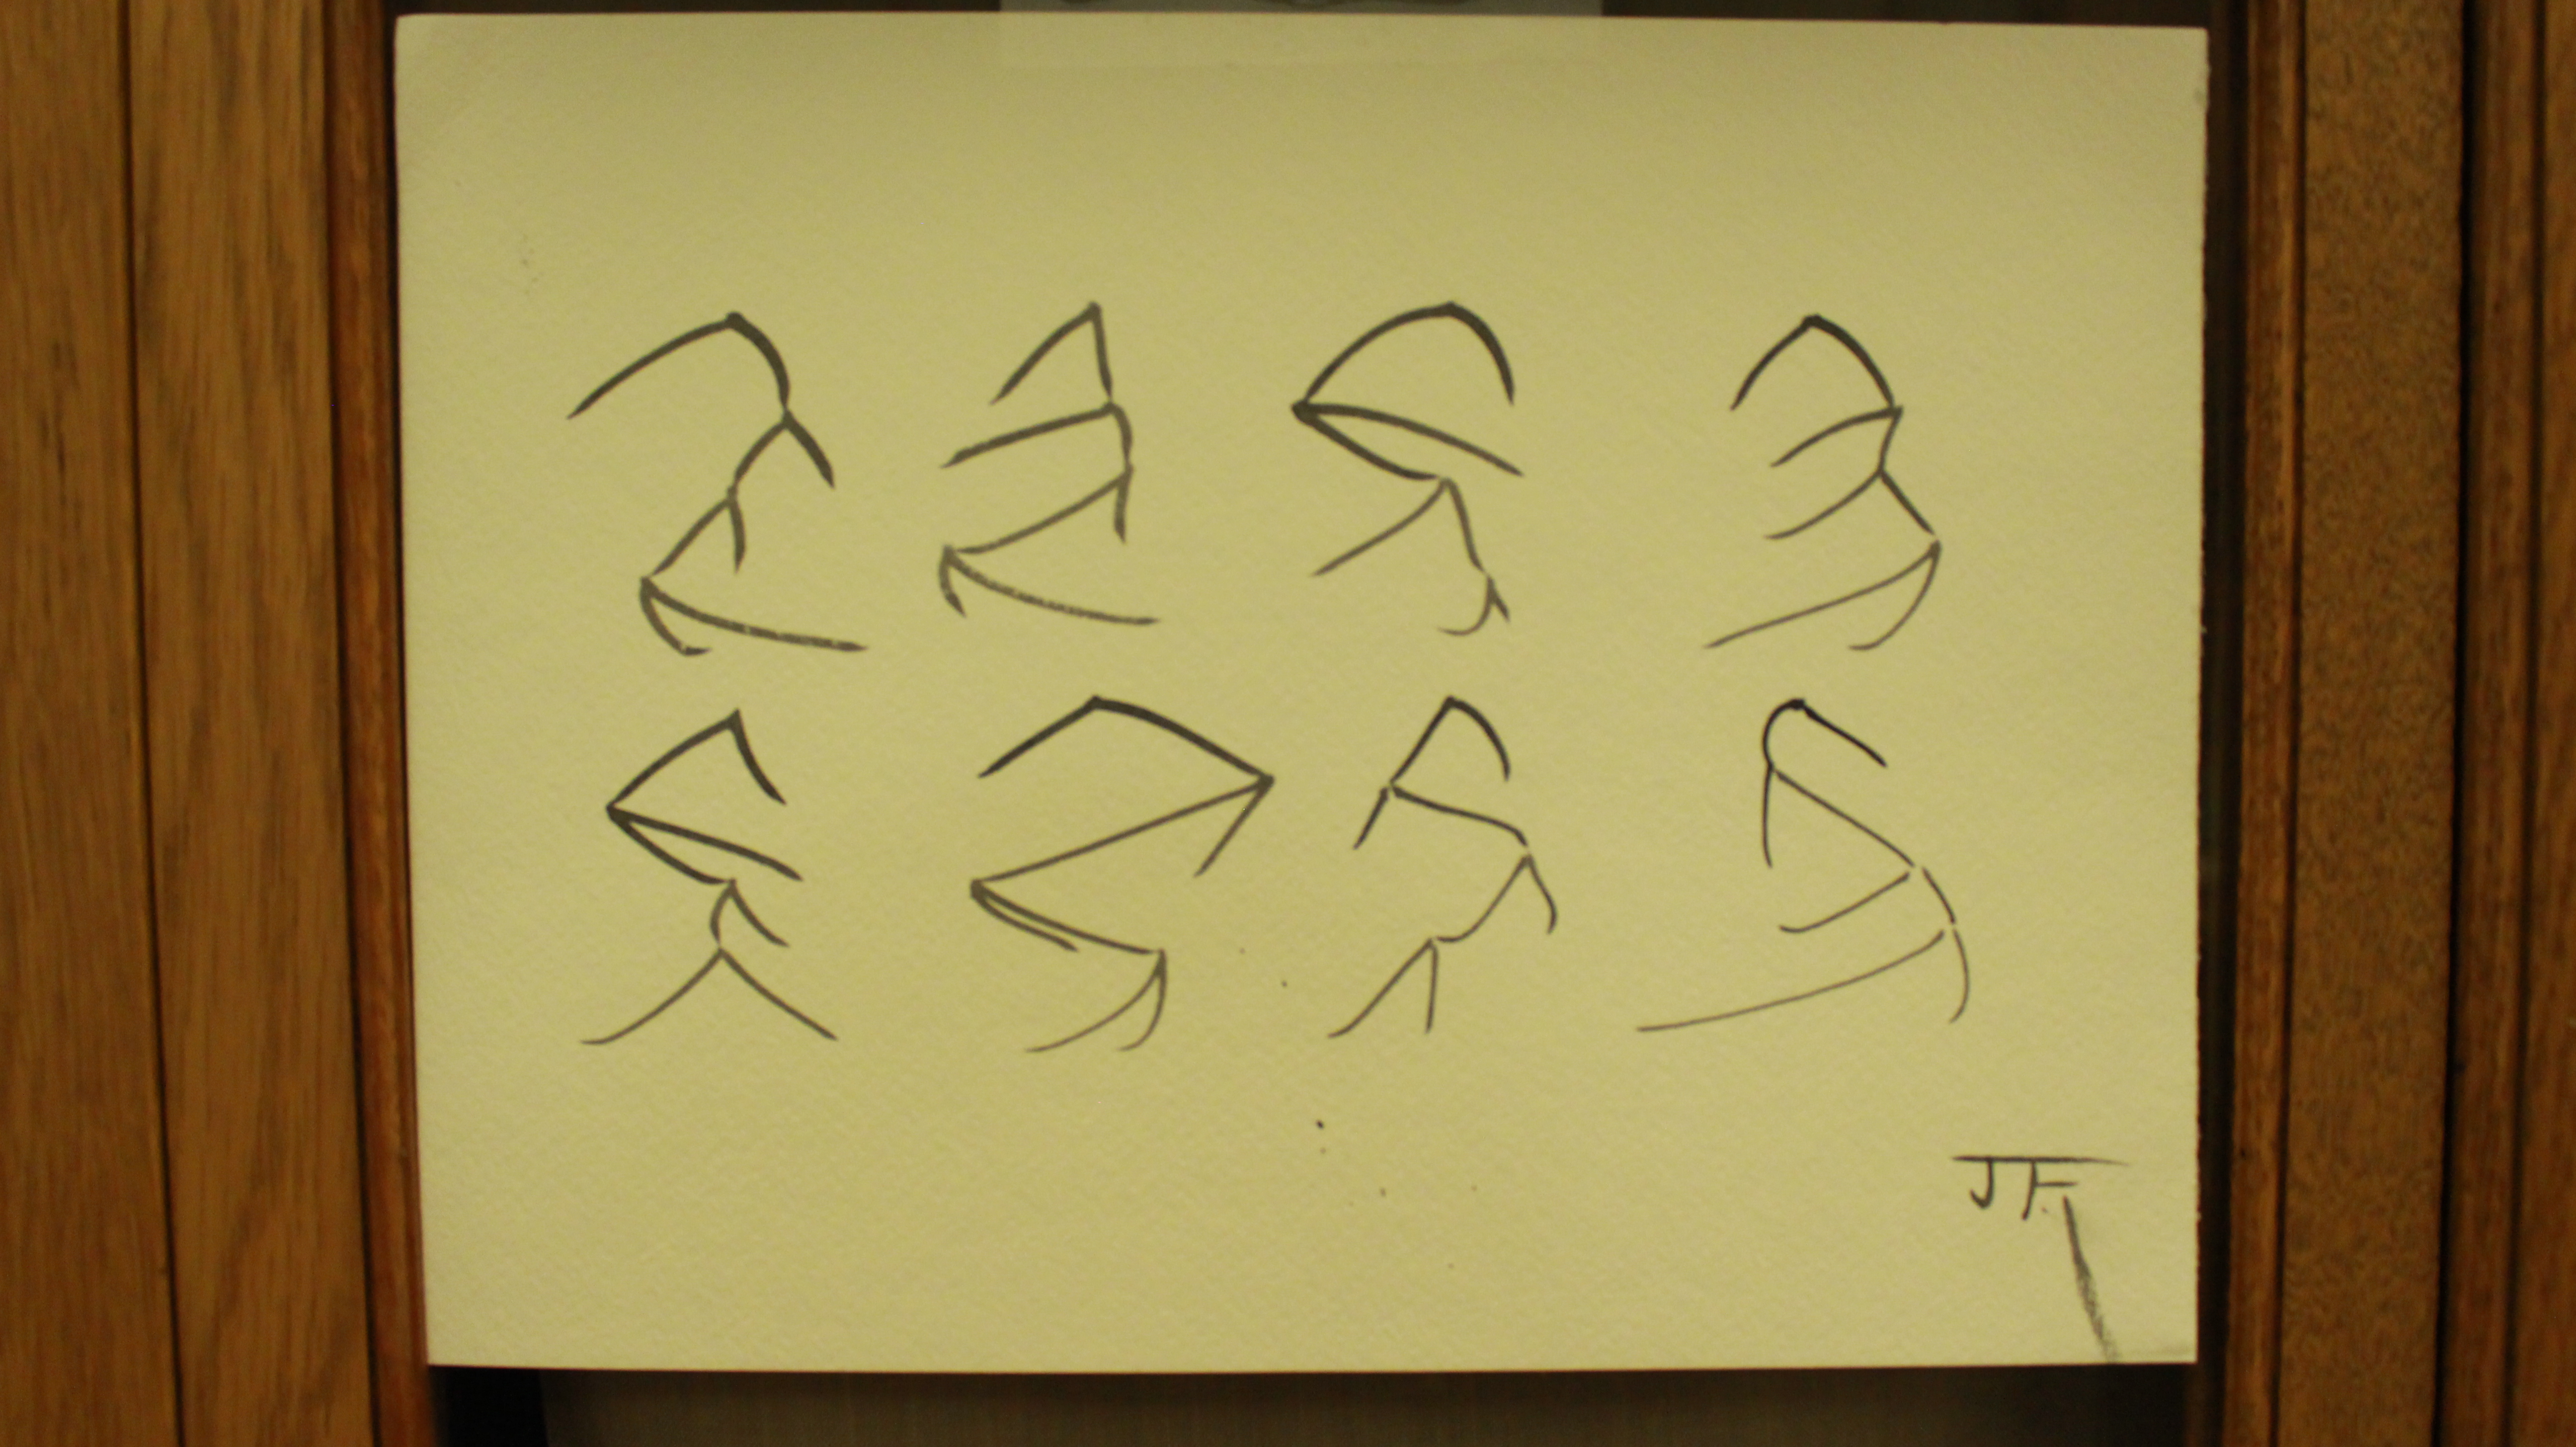
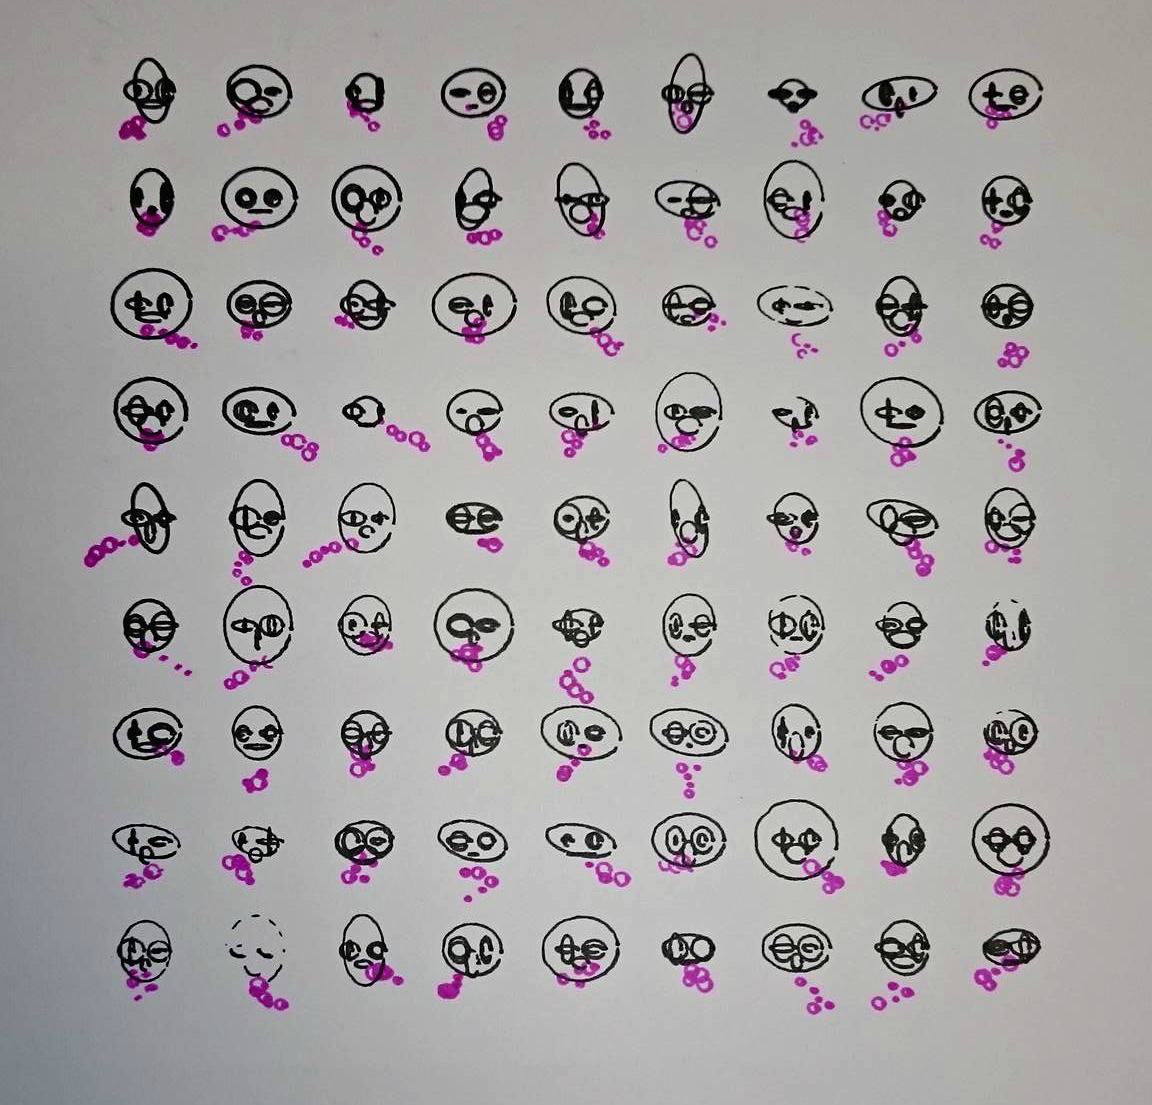
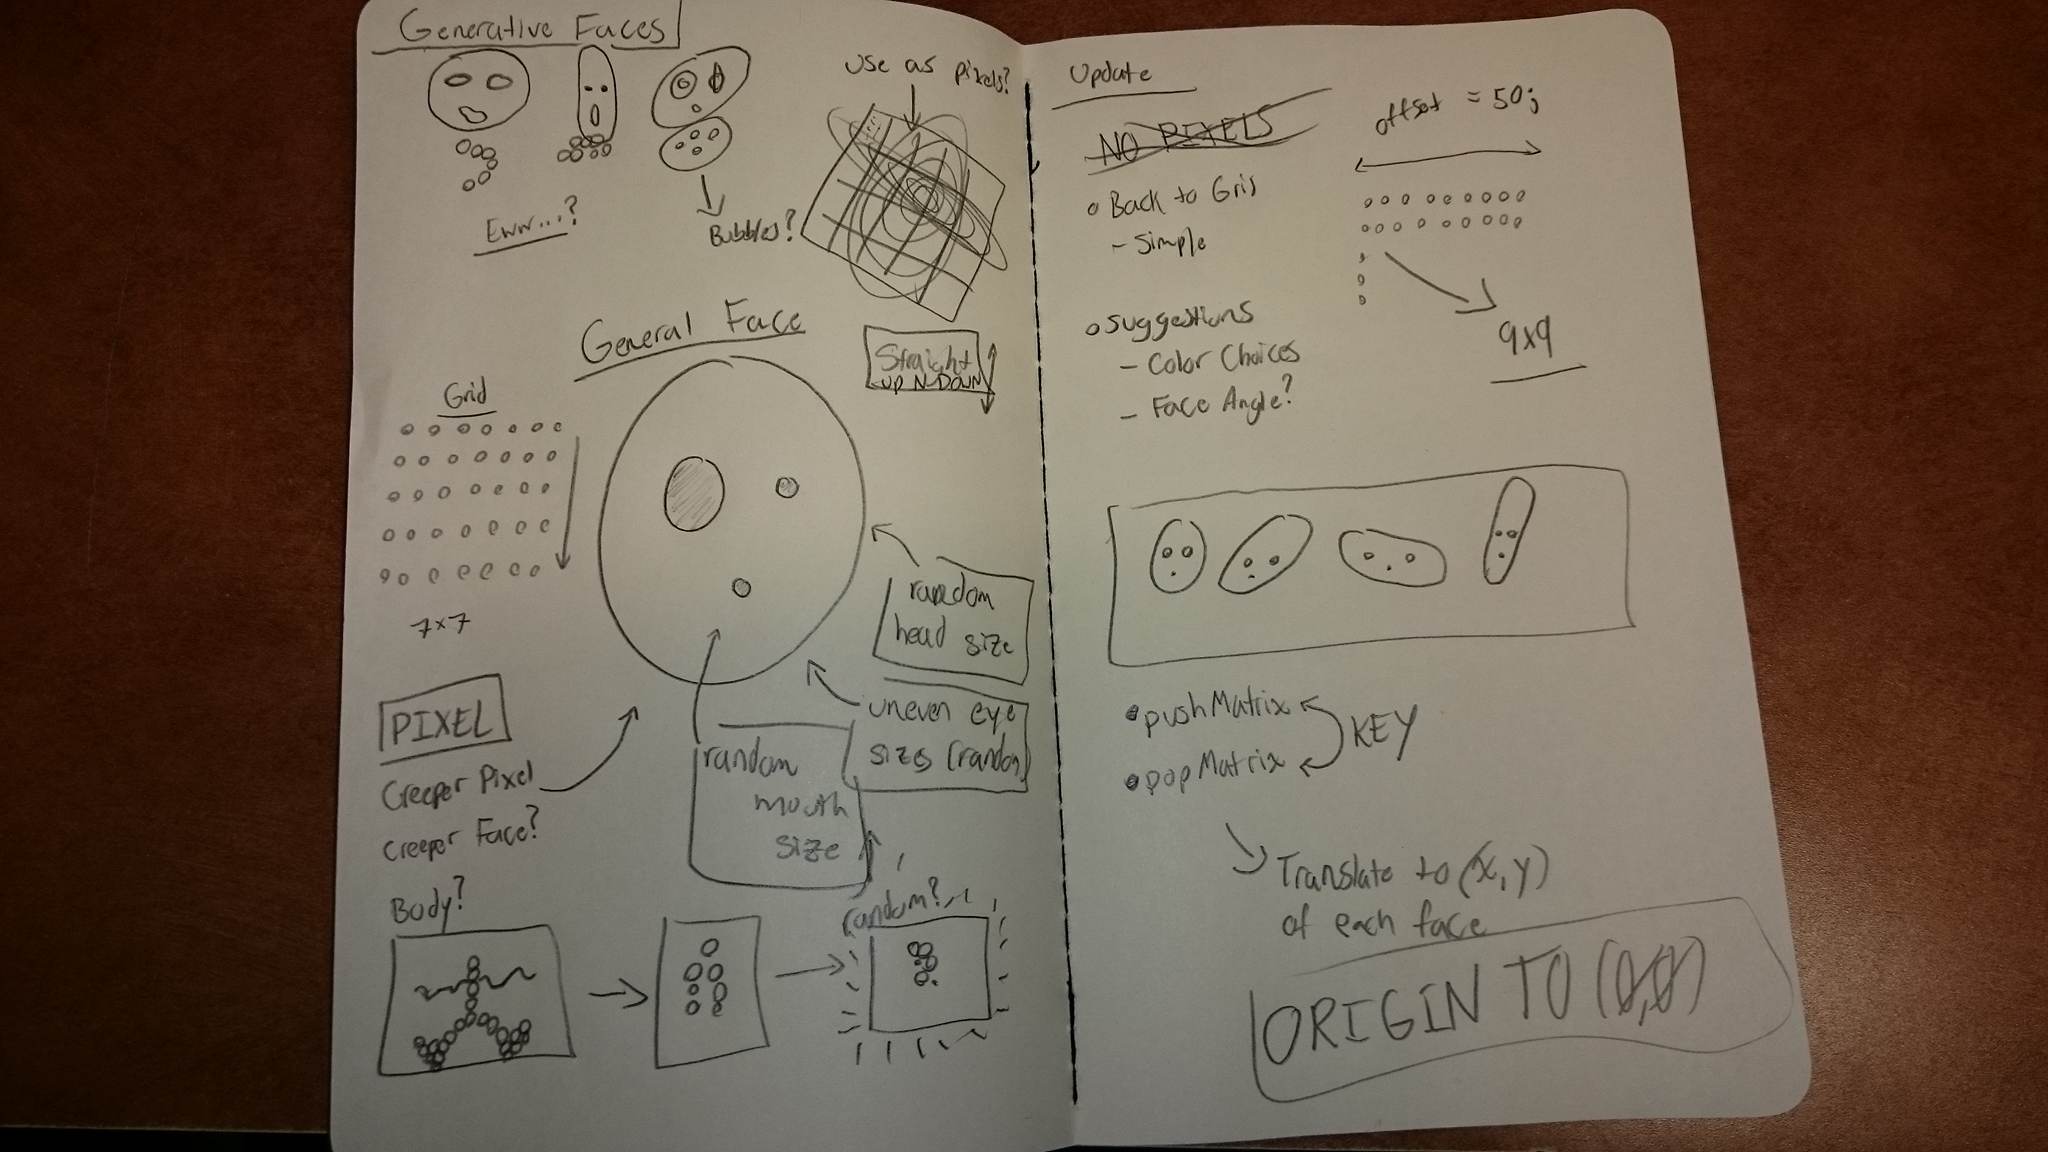
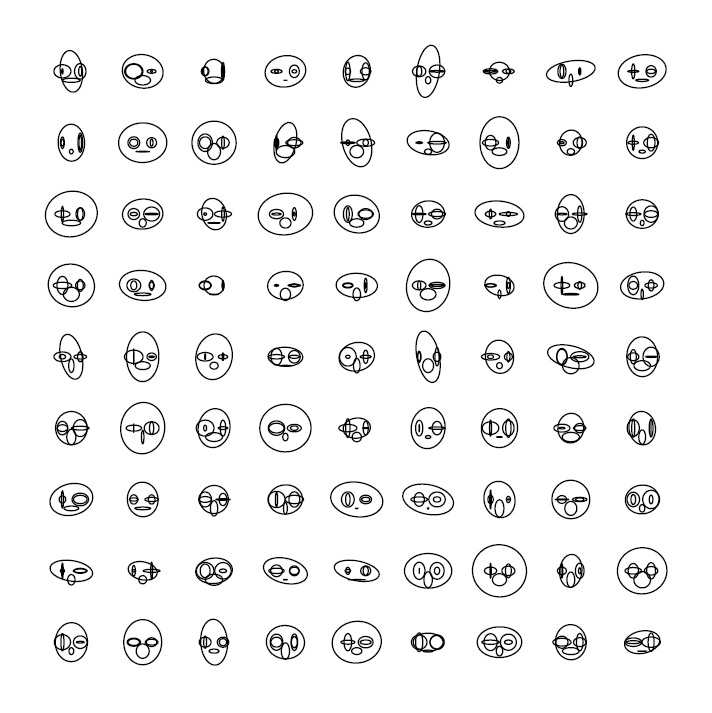
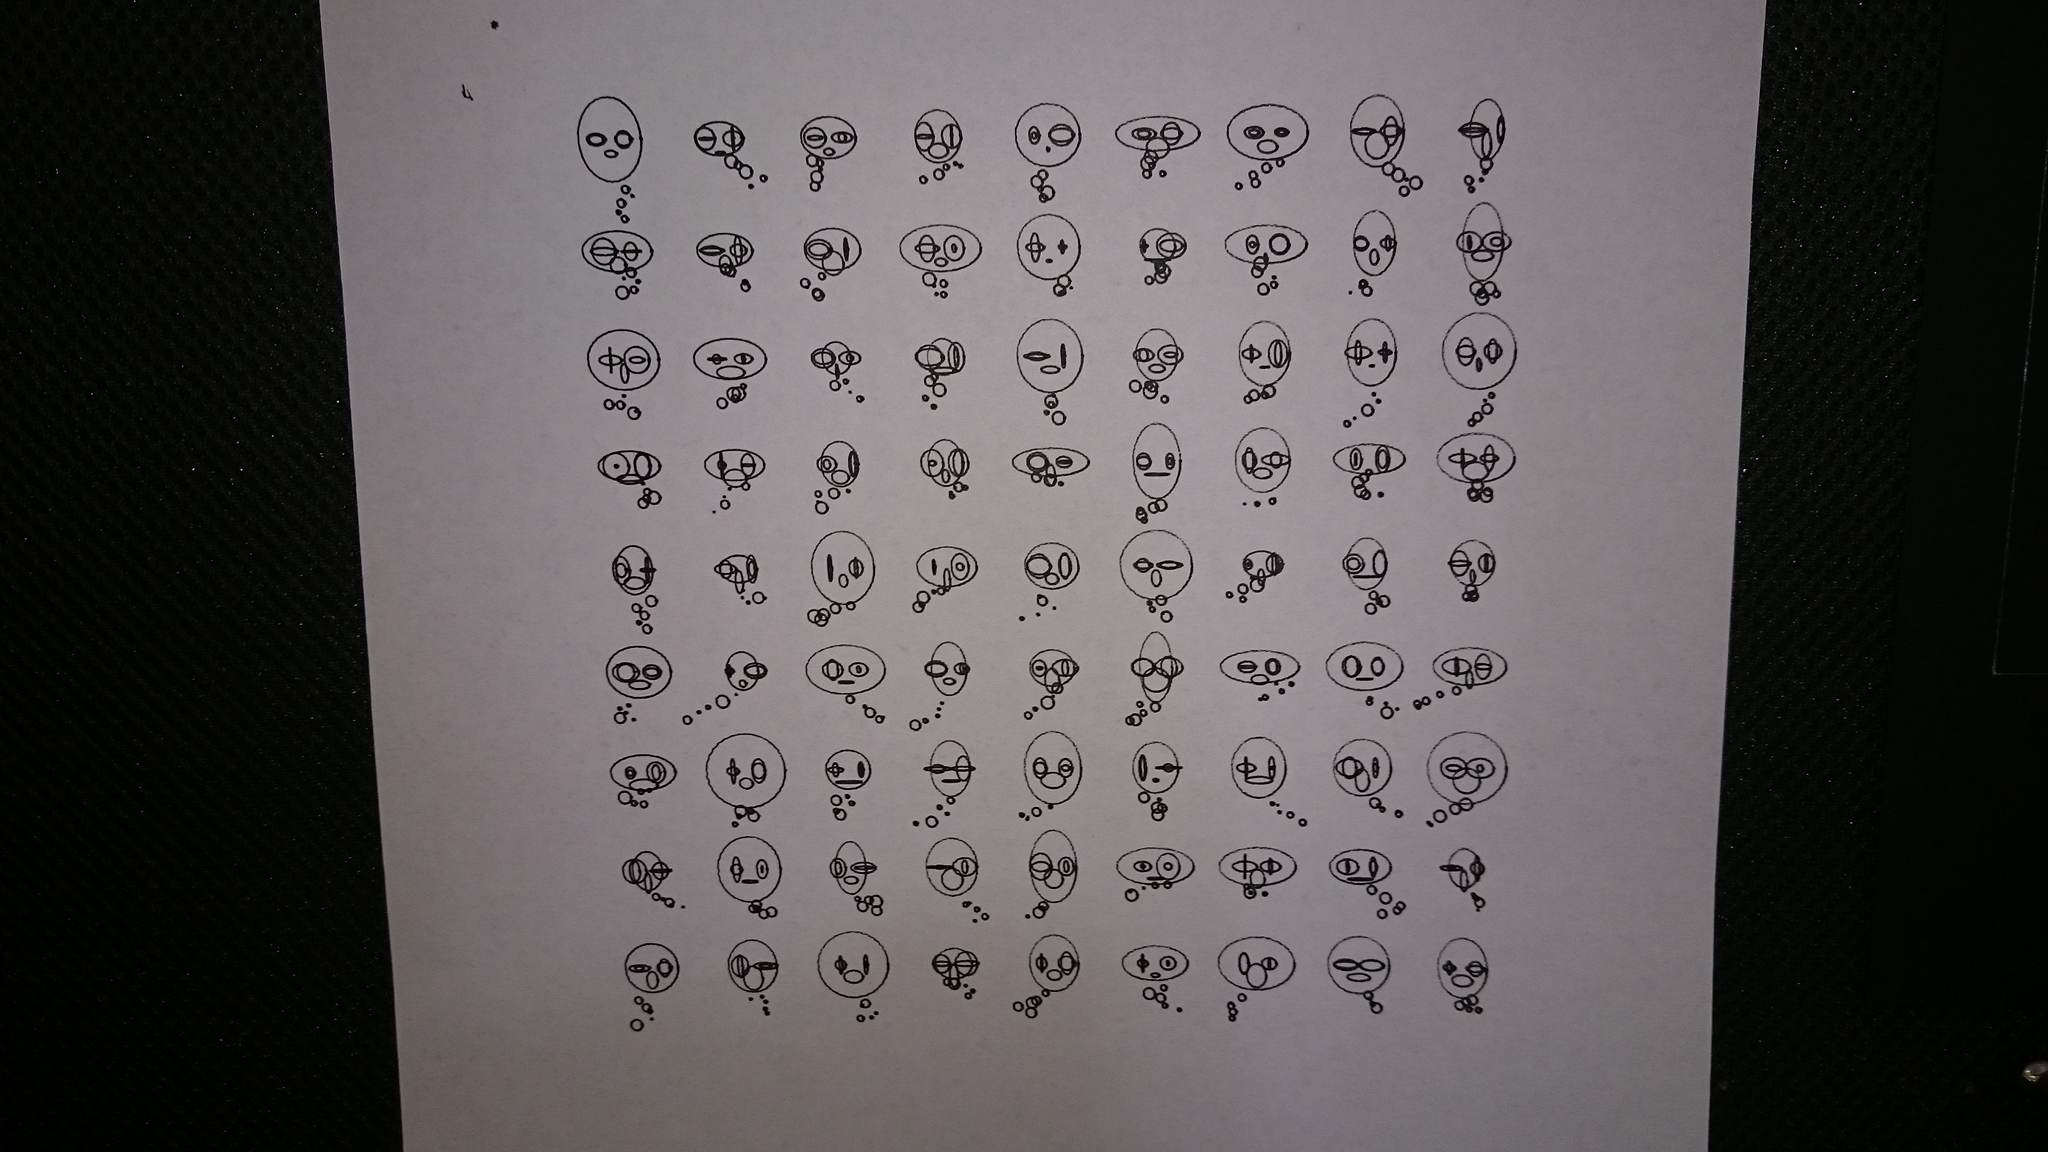
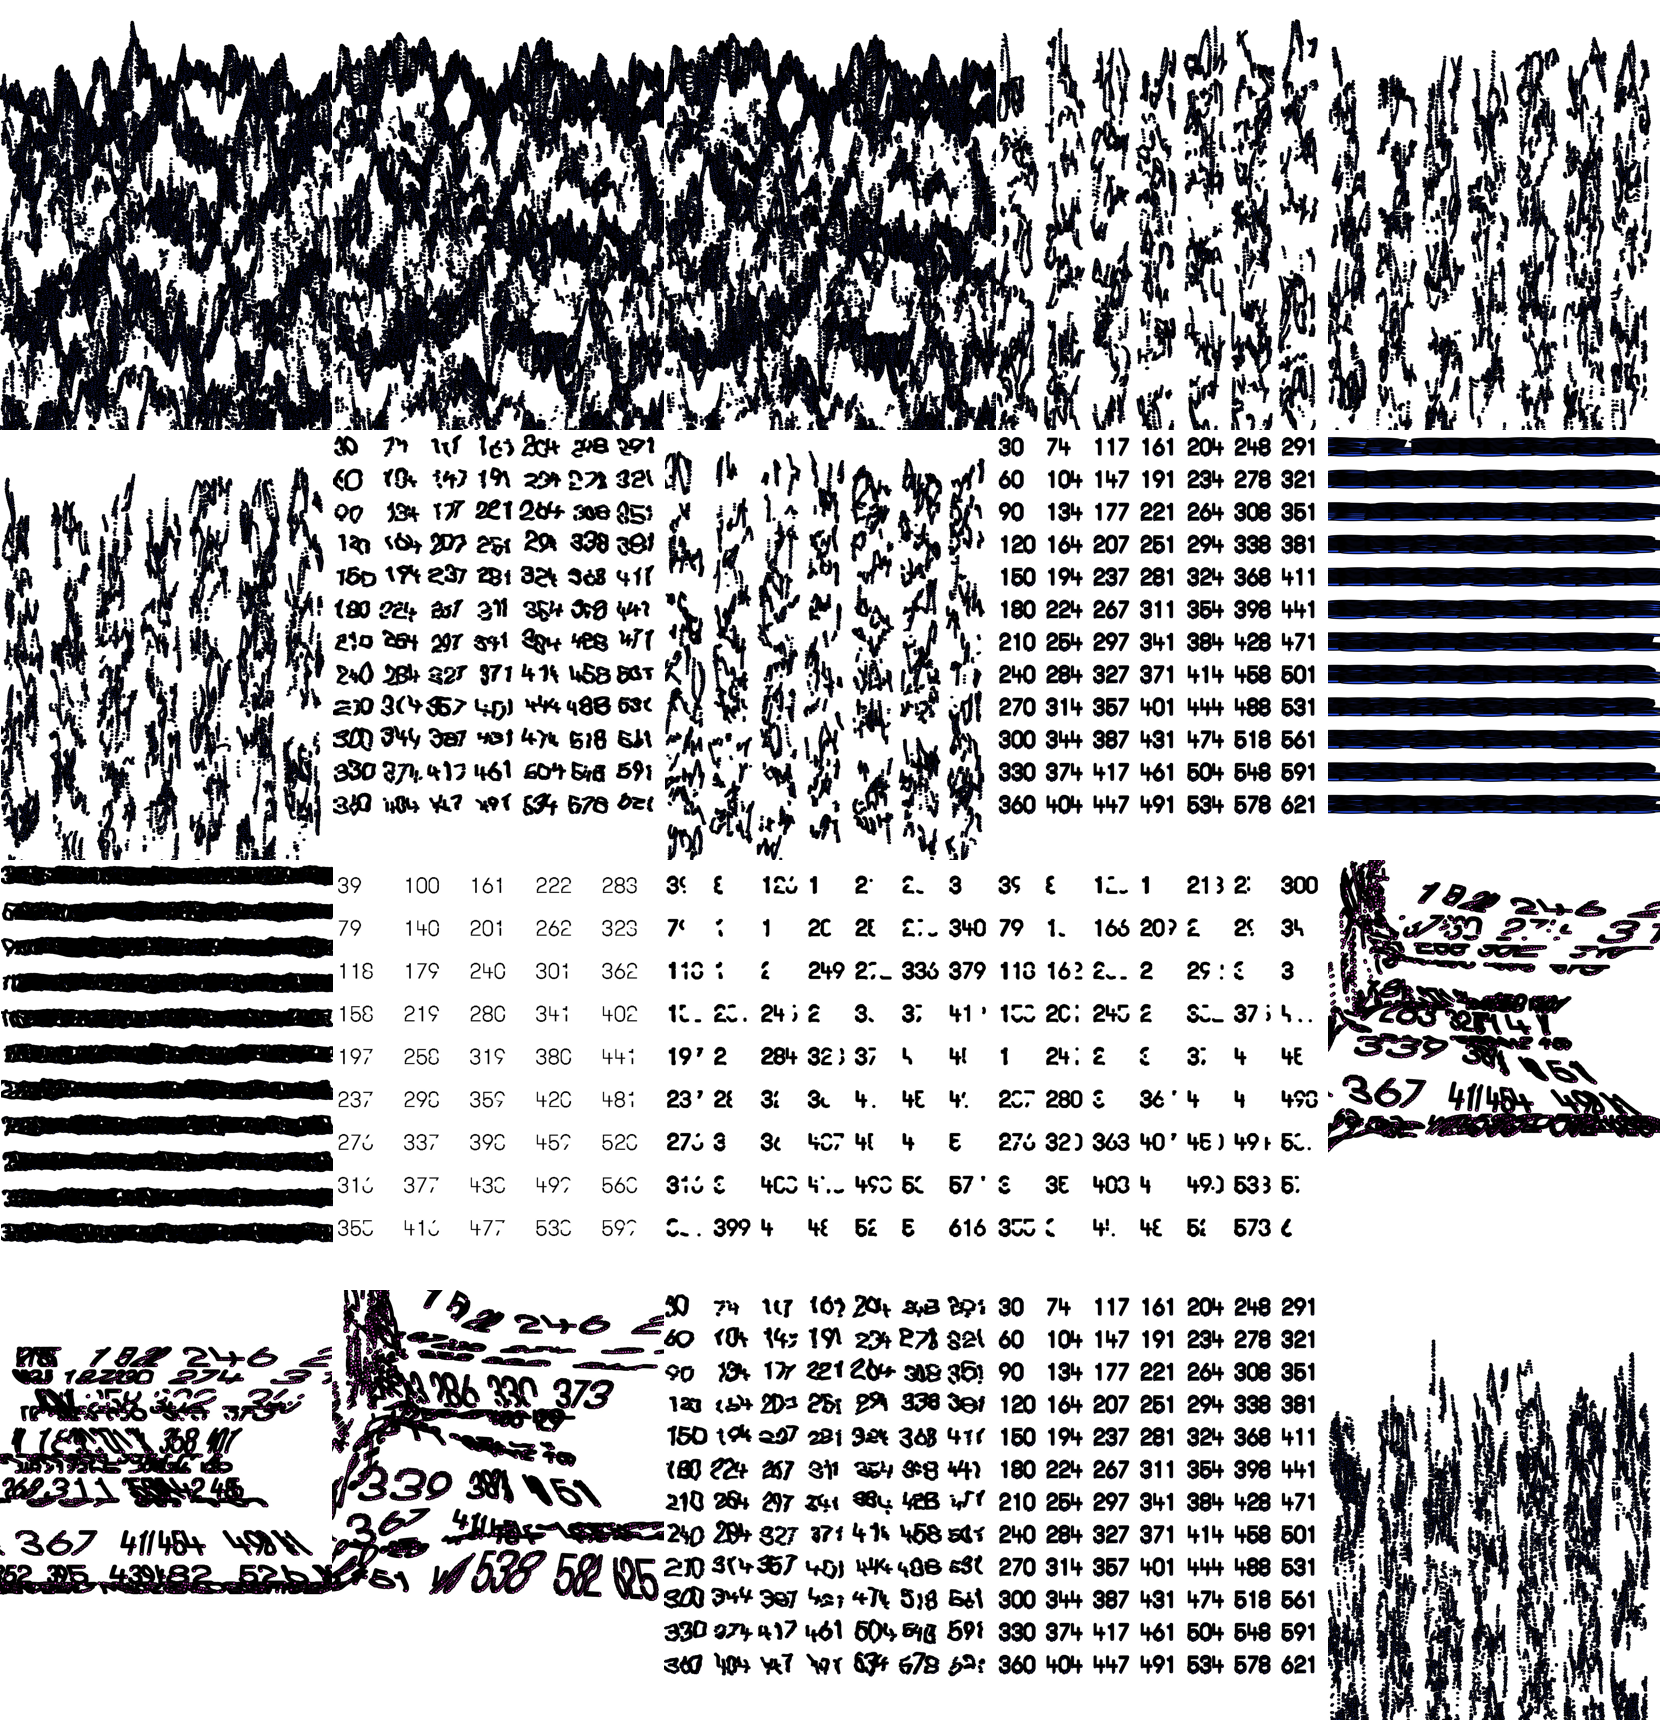
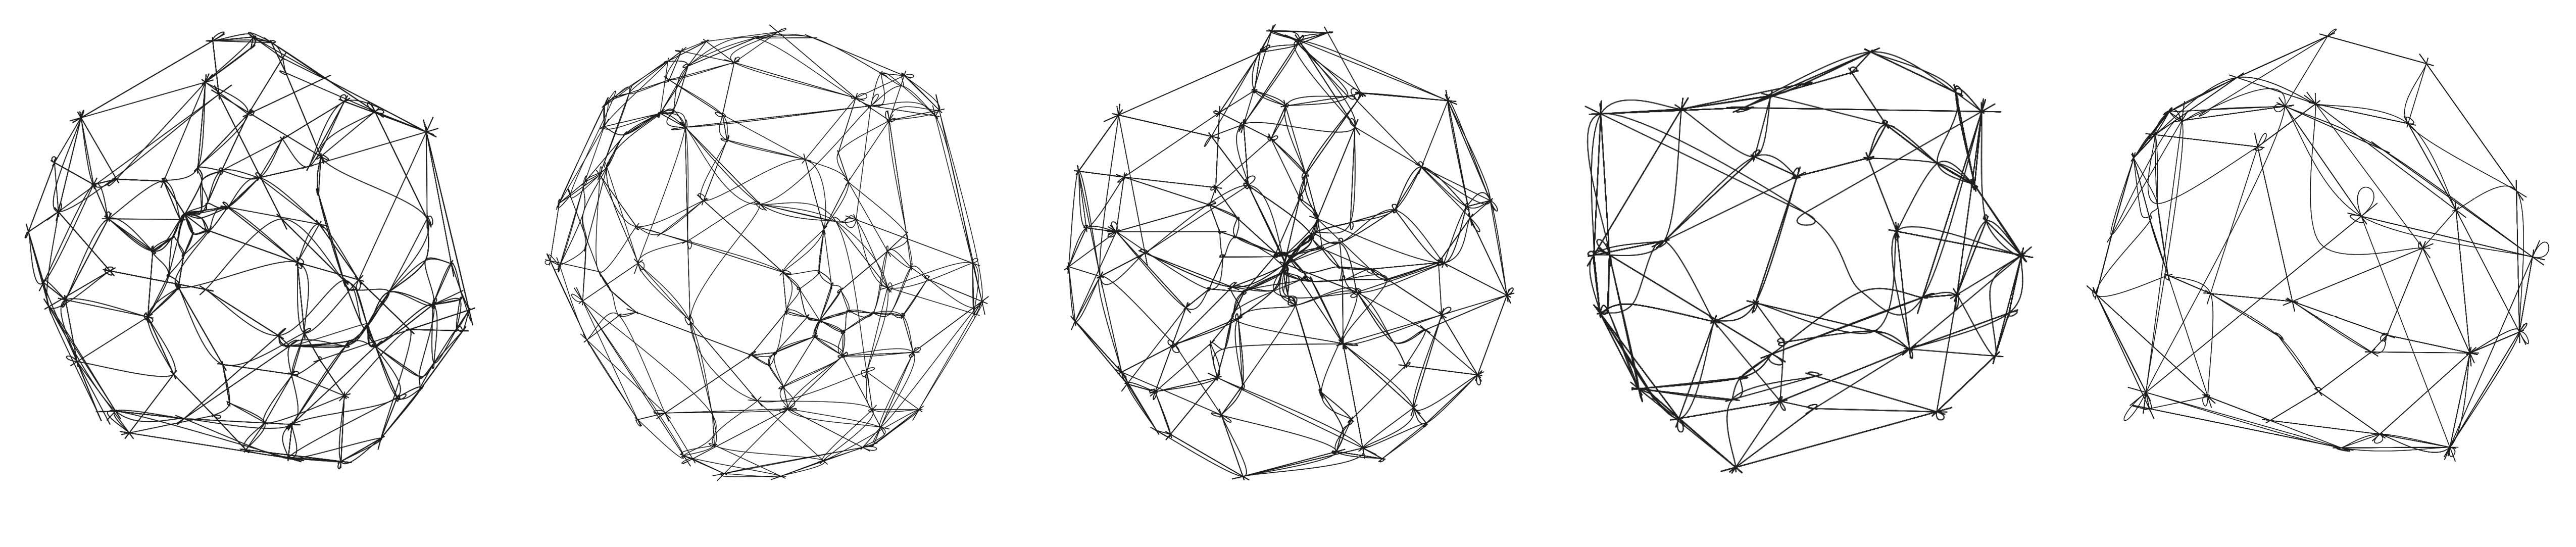
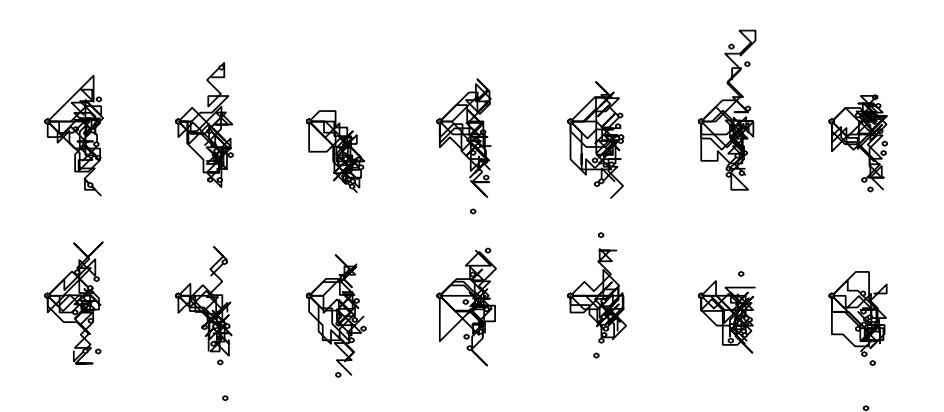
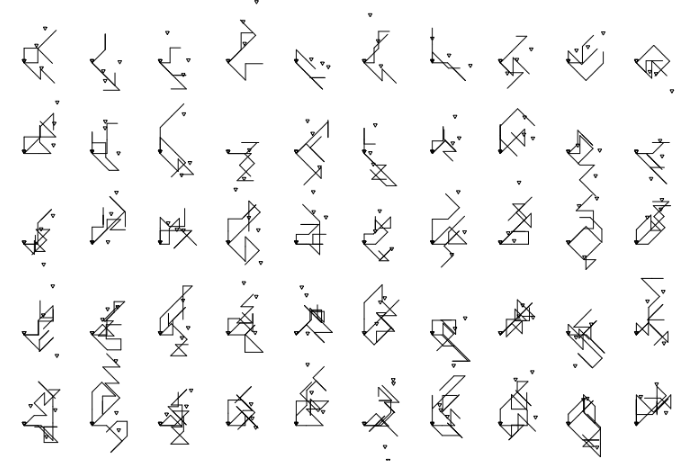
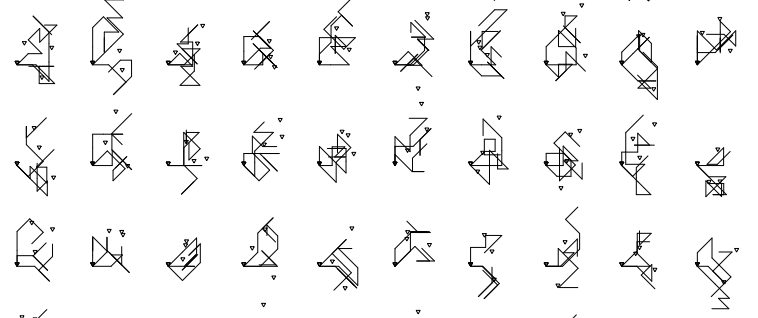
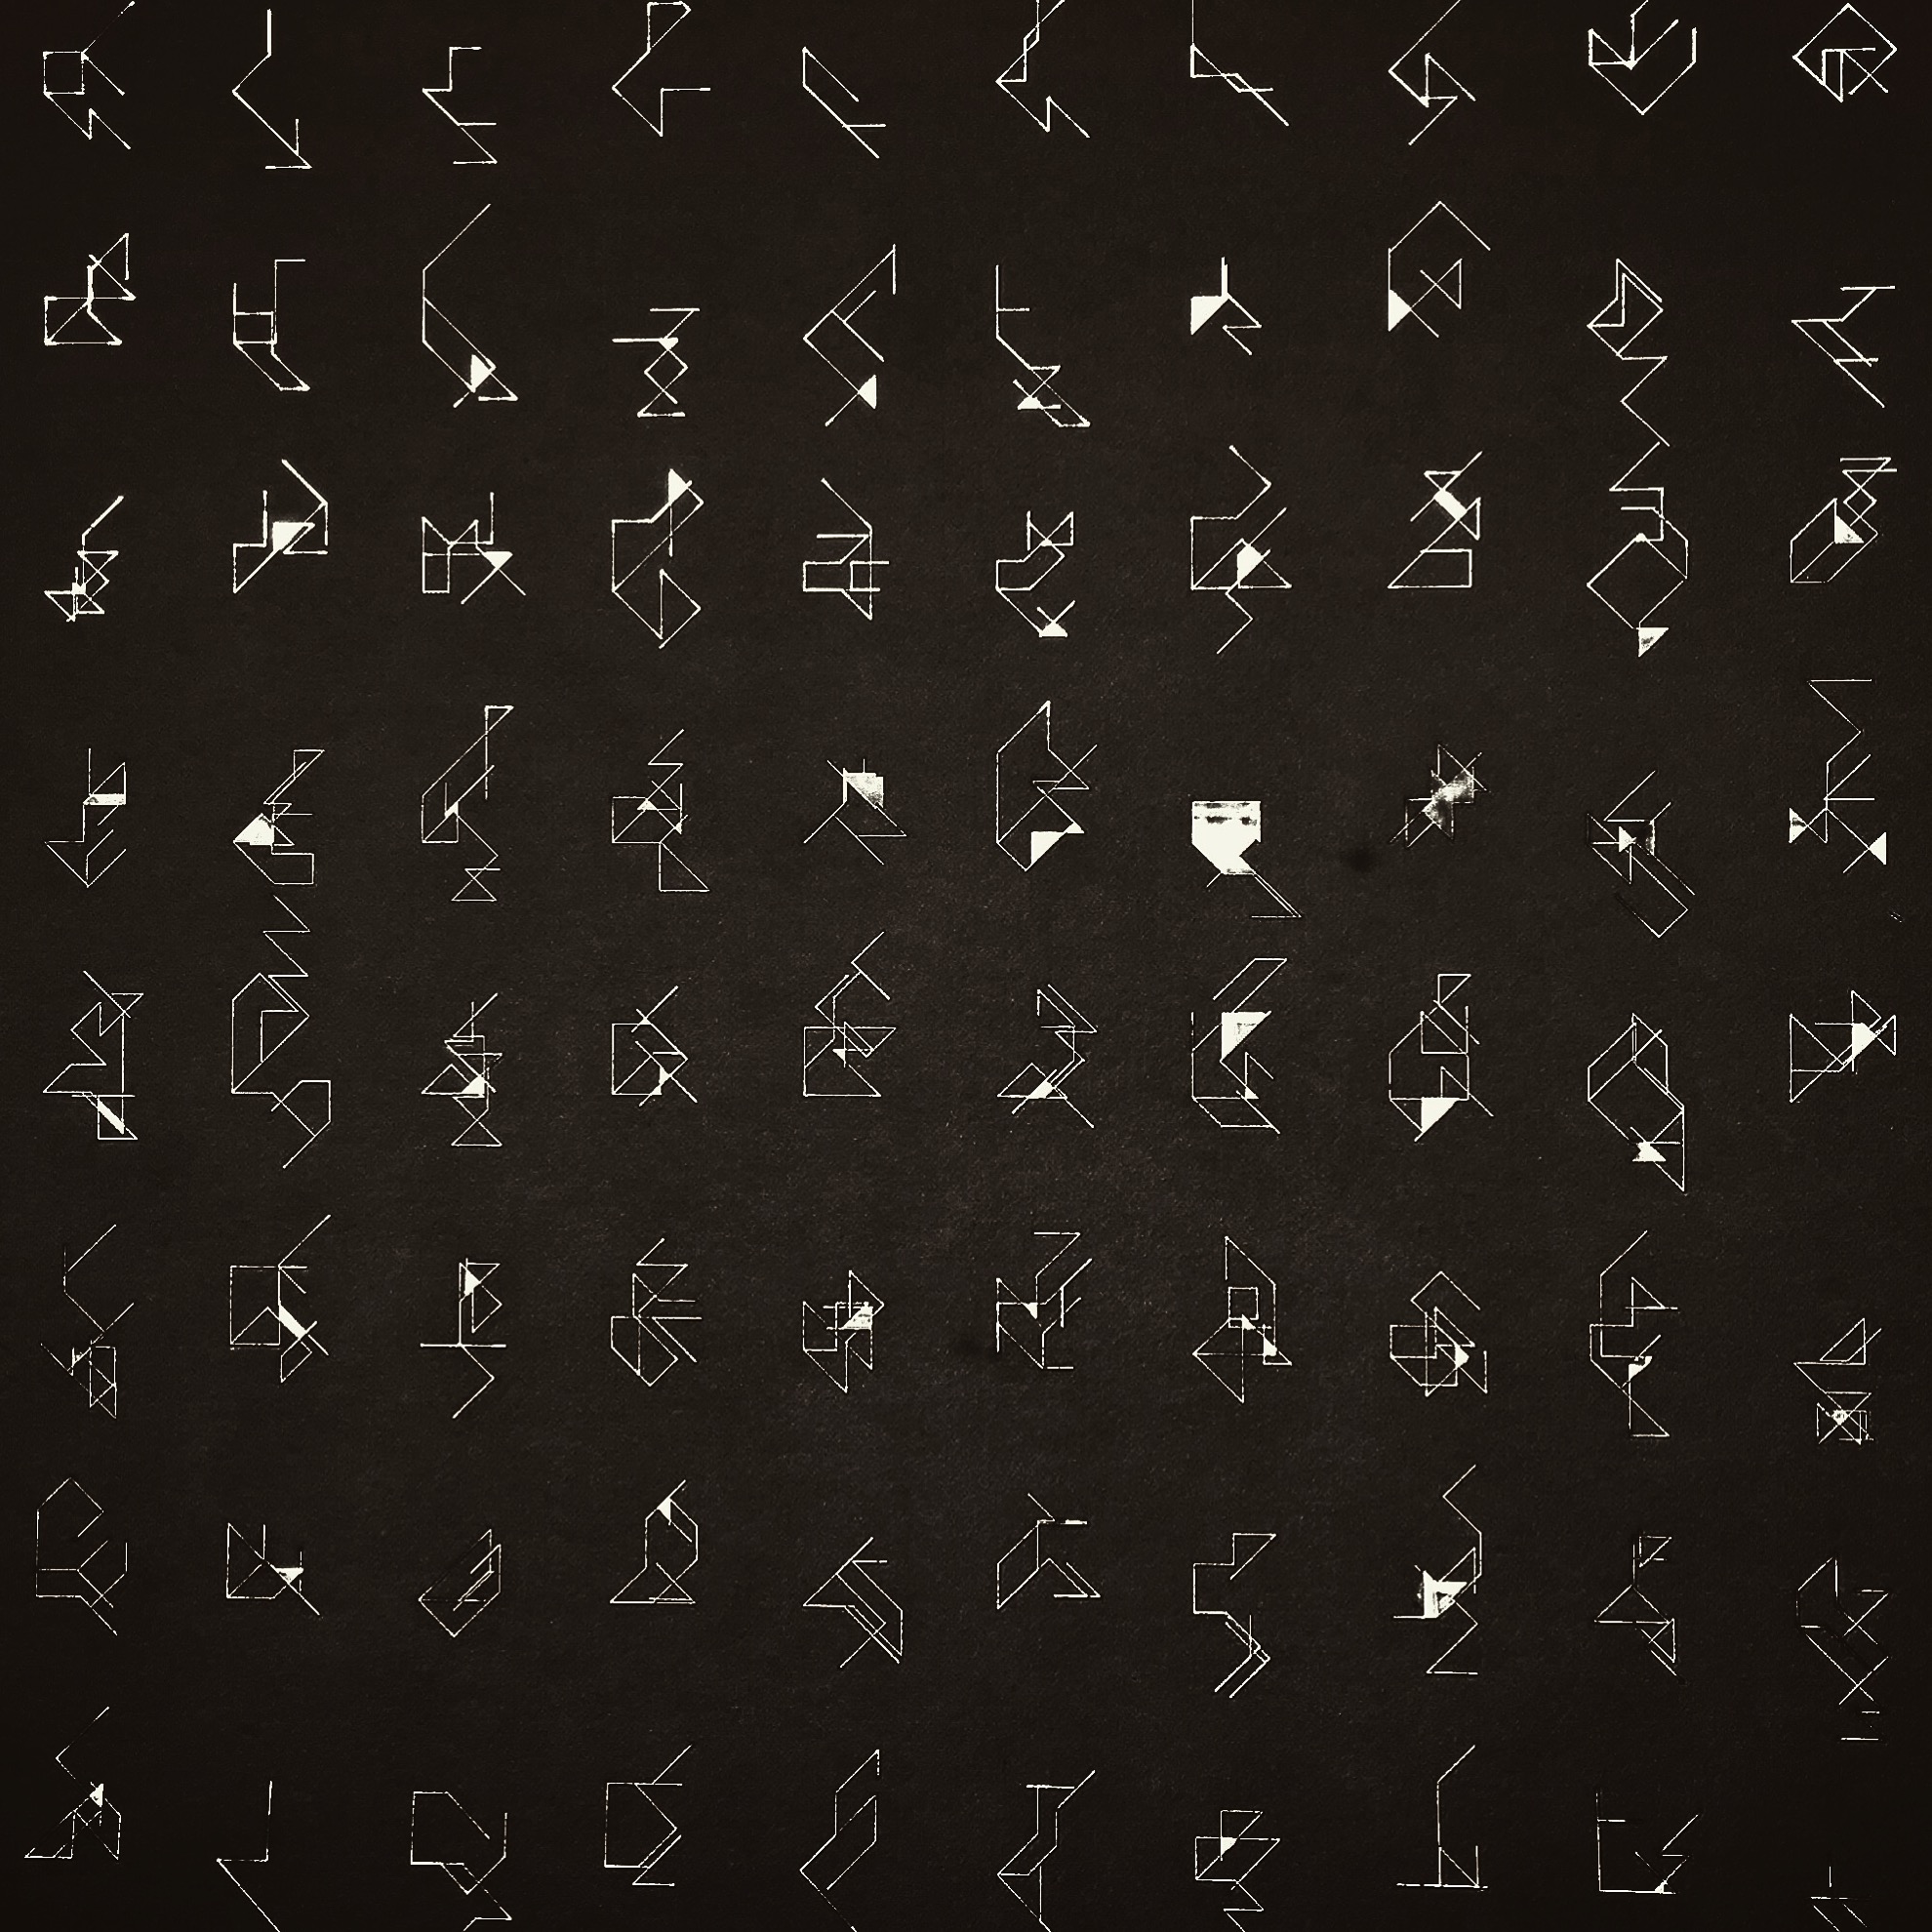
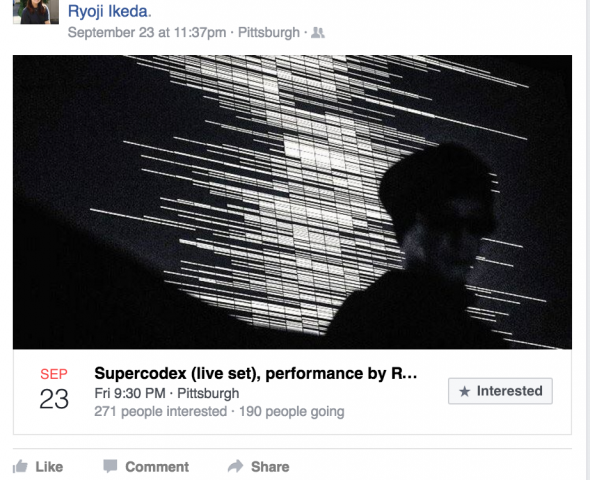
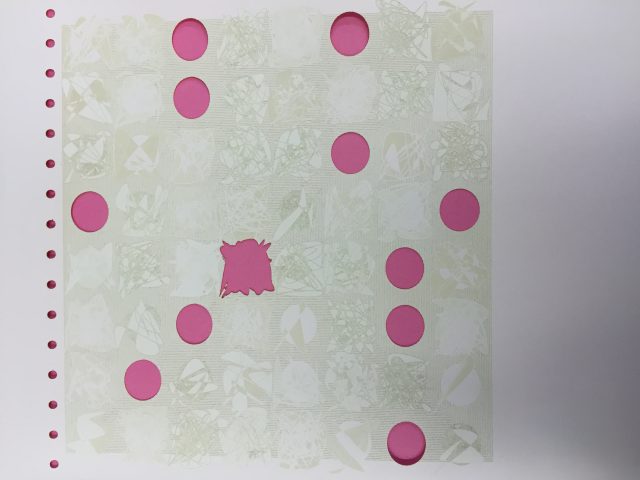
I kicked off my thought process for this project thinking about this font specimen and how I liked the seemingly arbitrary selection of numbers used. I wanted to create a system that would allow the continual generation of such values and also the spatial placement of such (typographic) numbers.
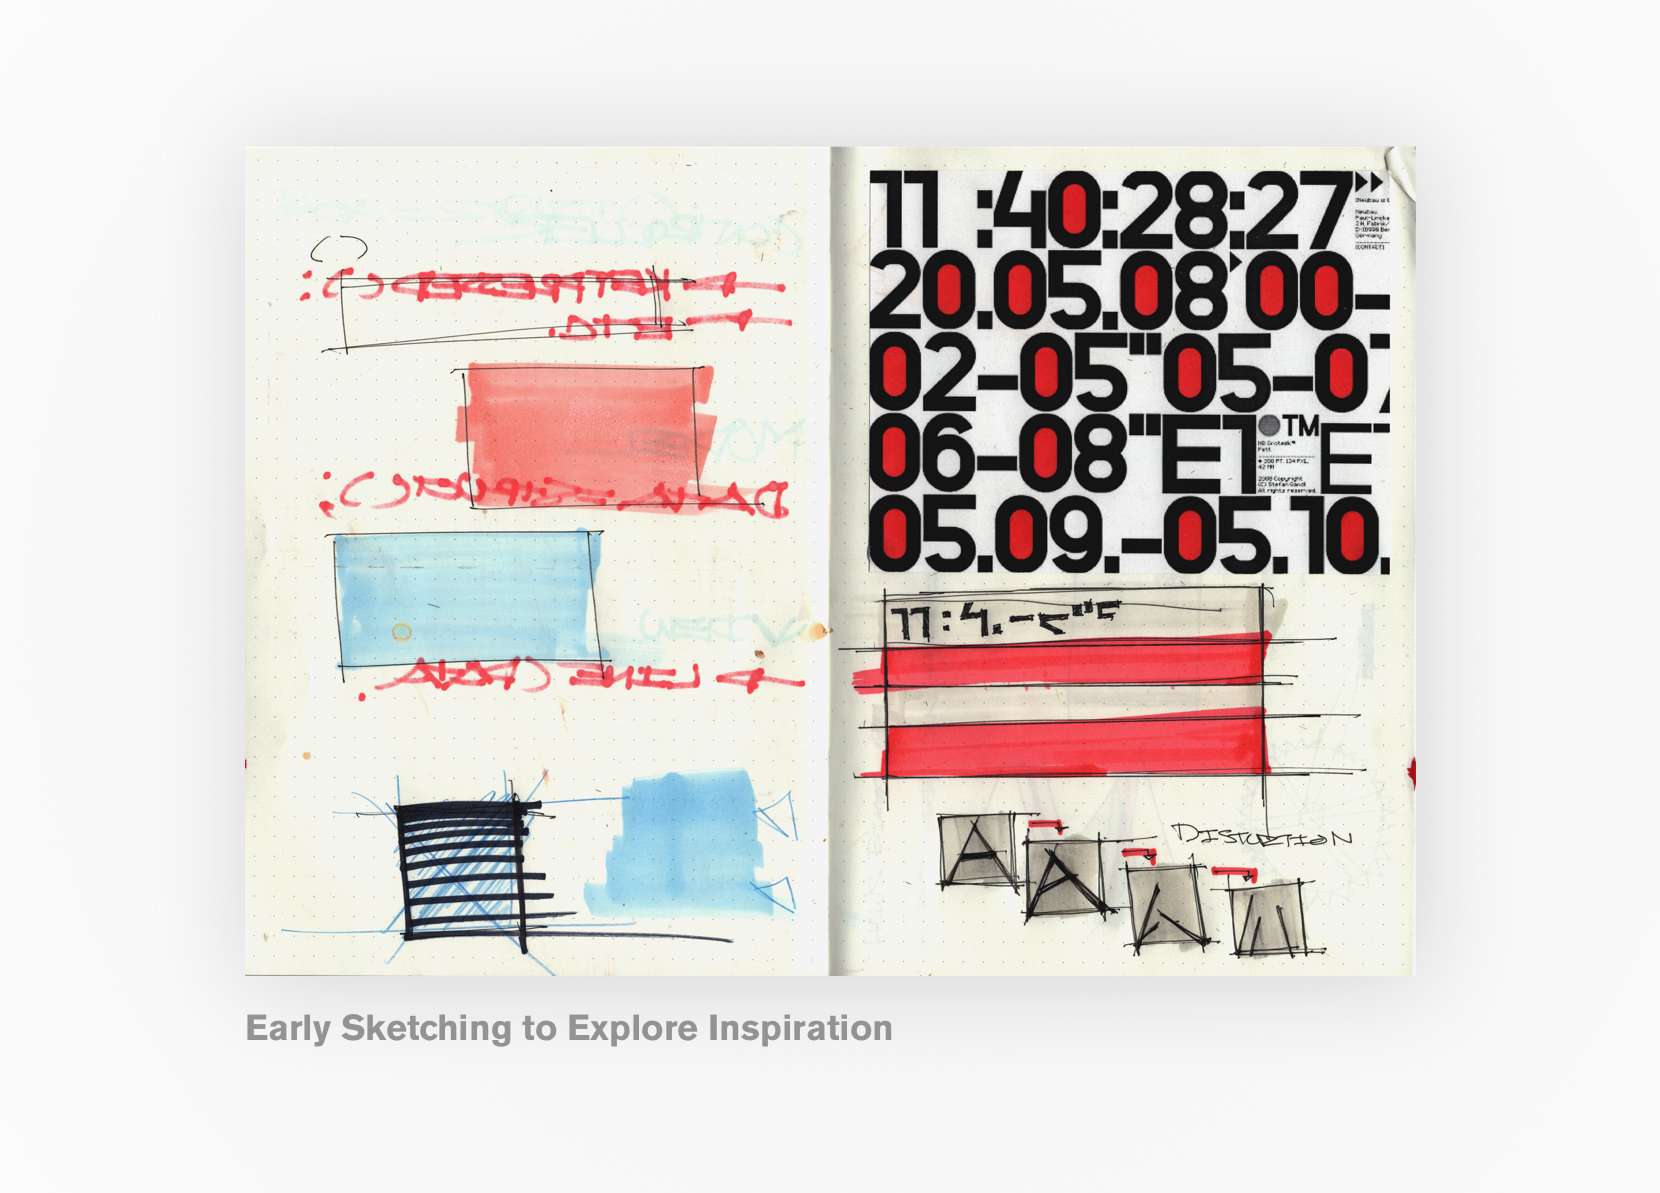
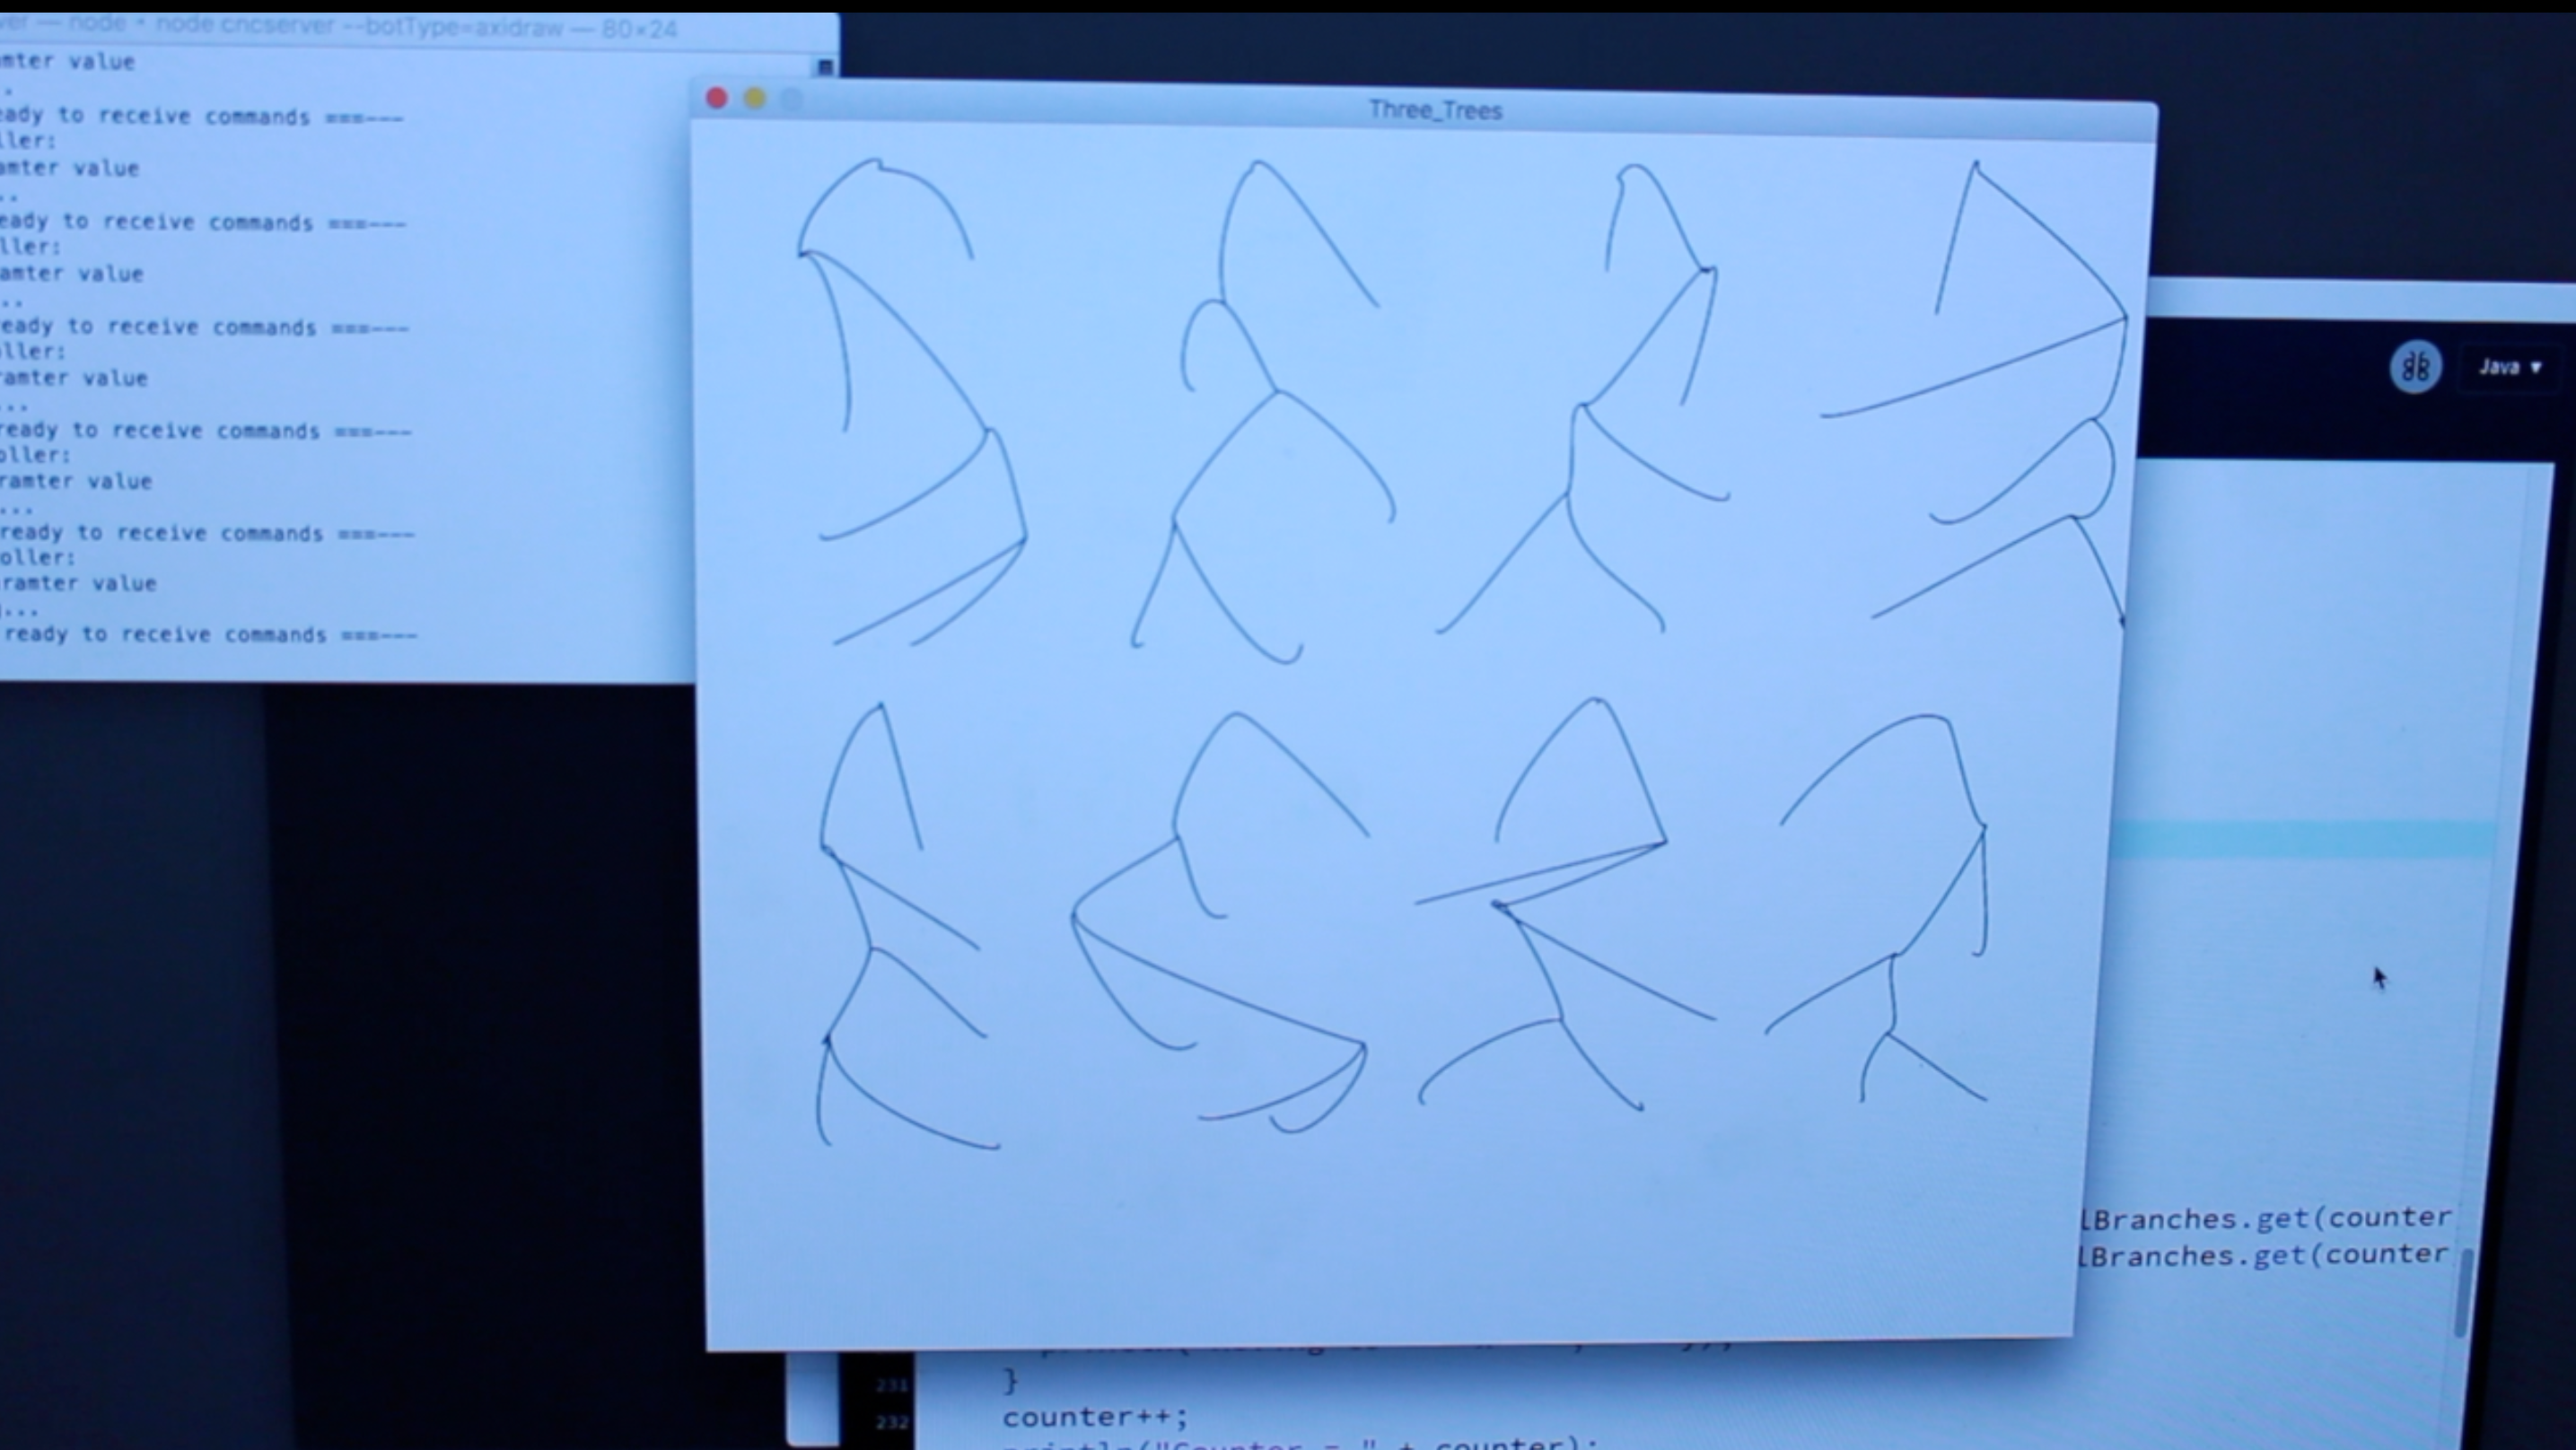
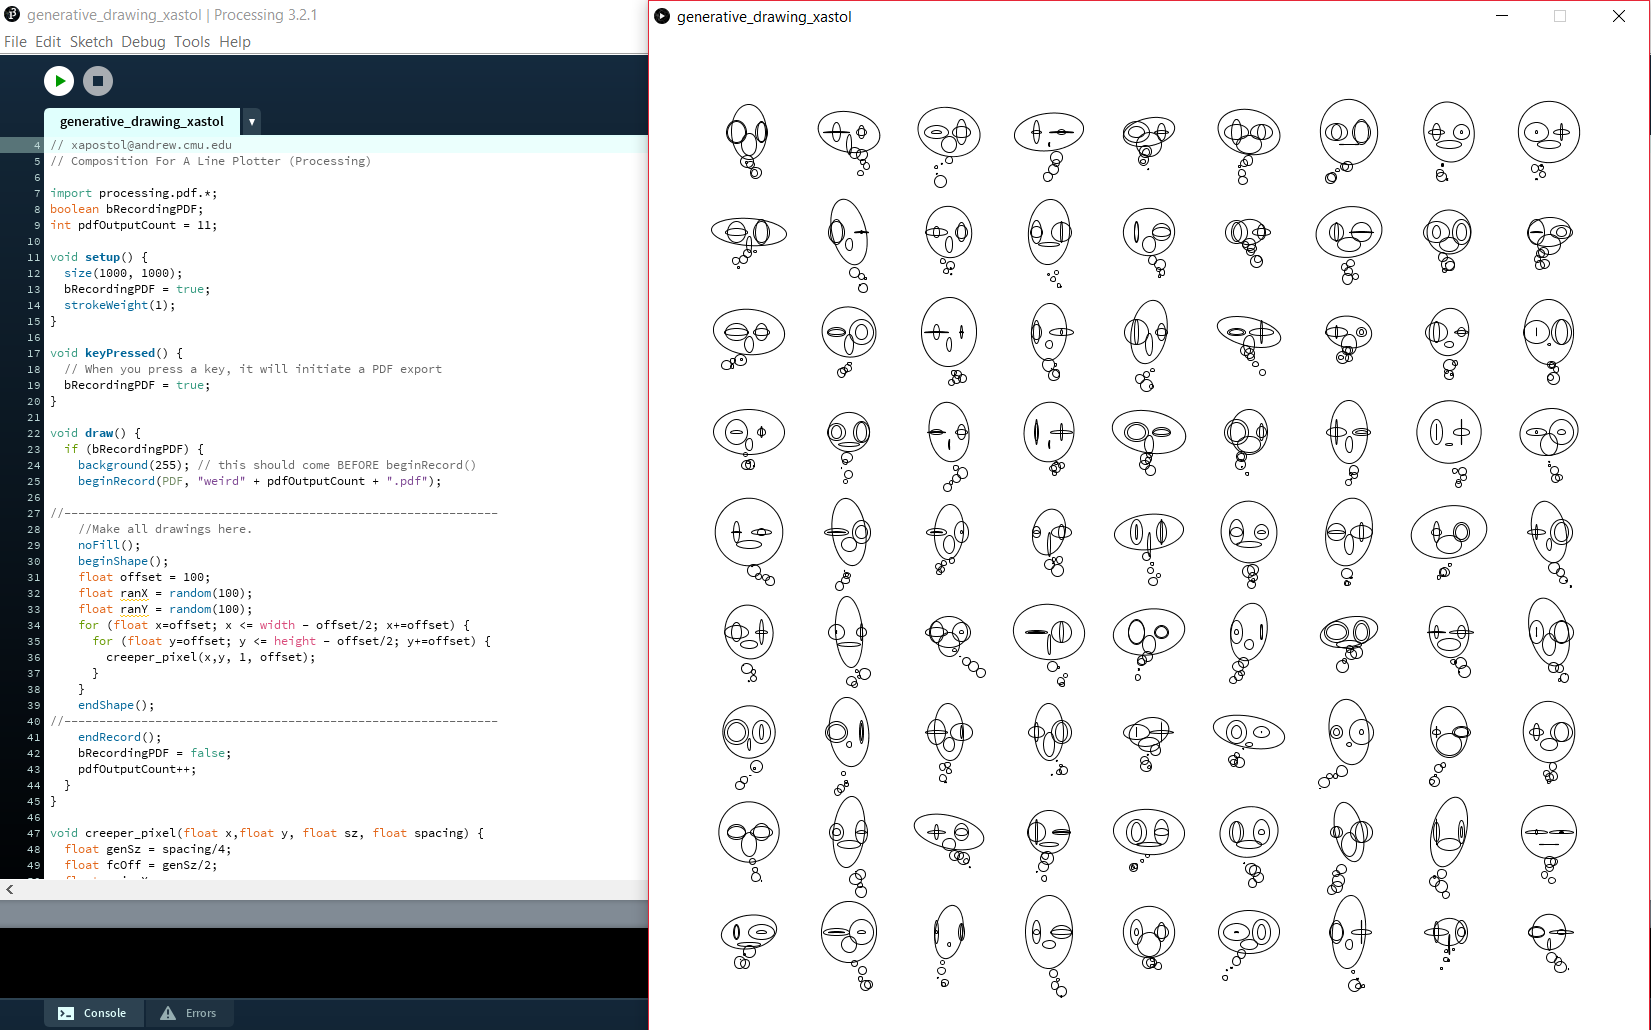
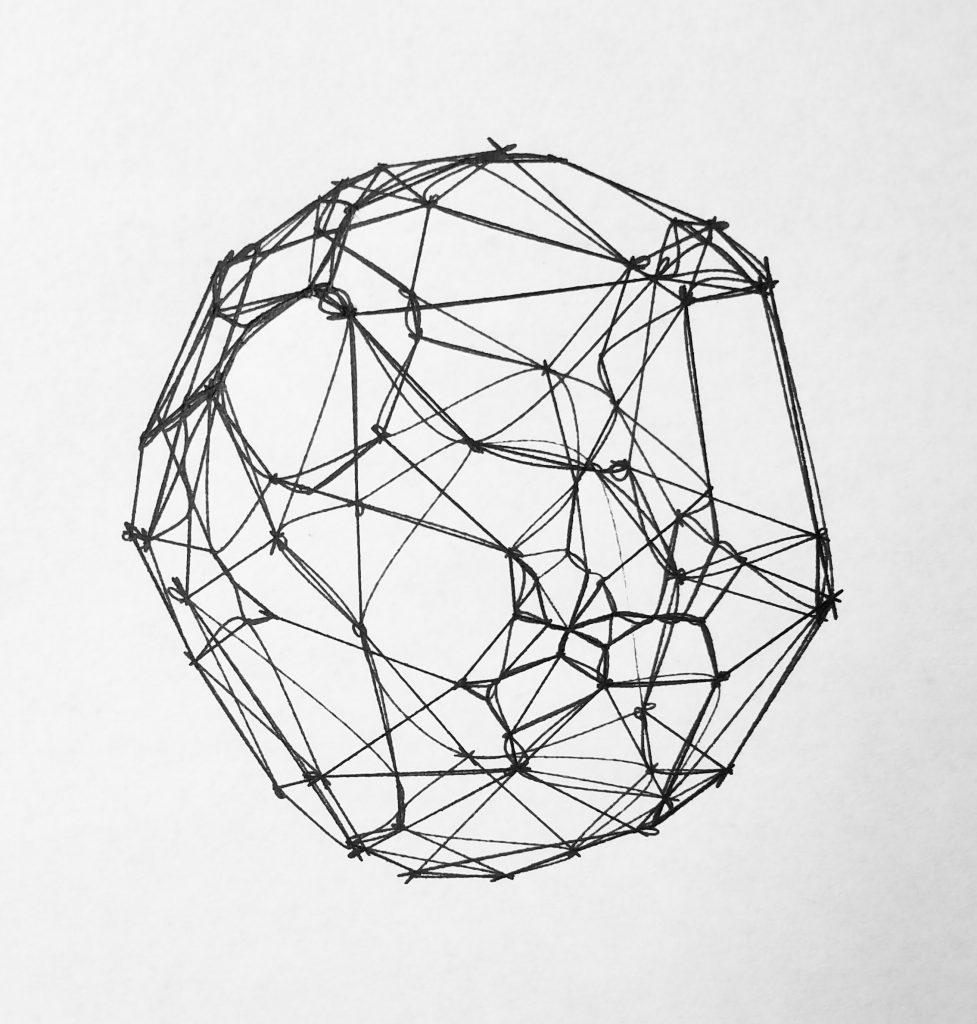
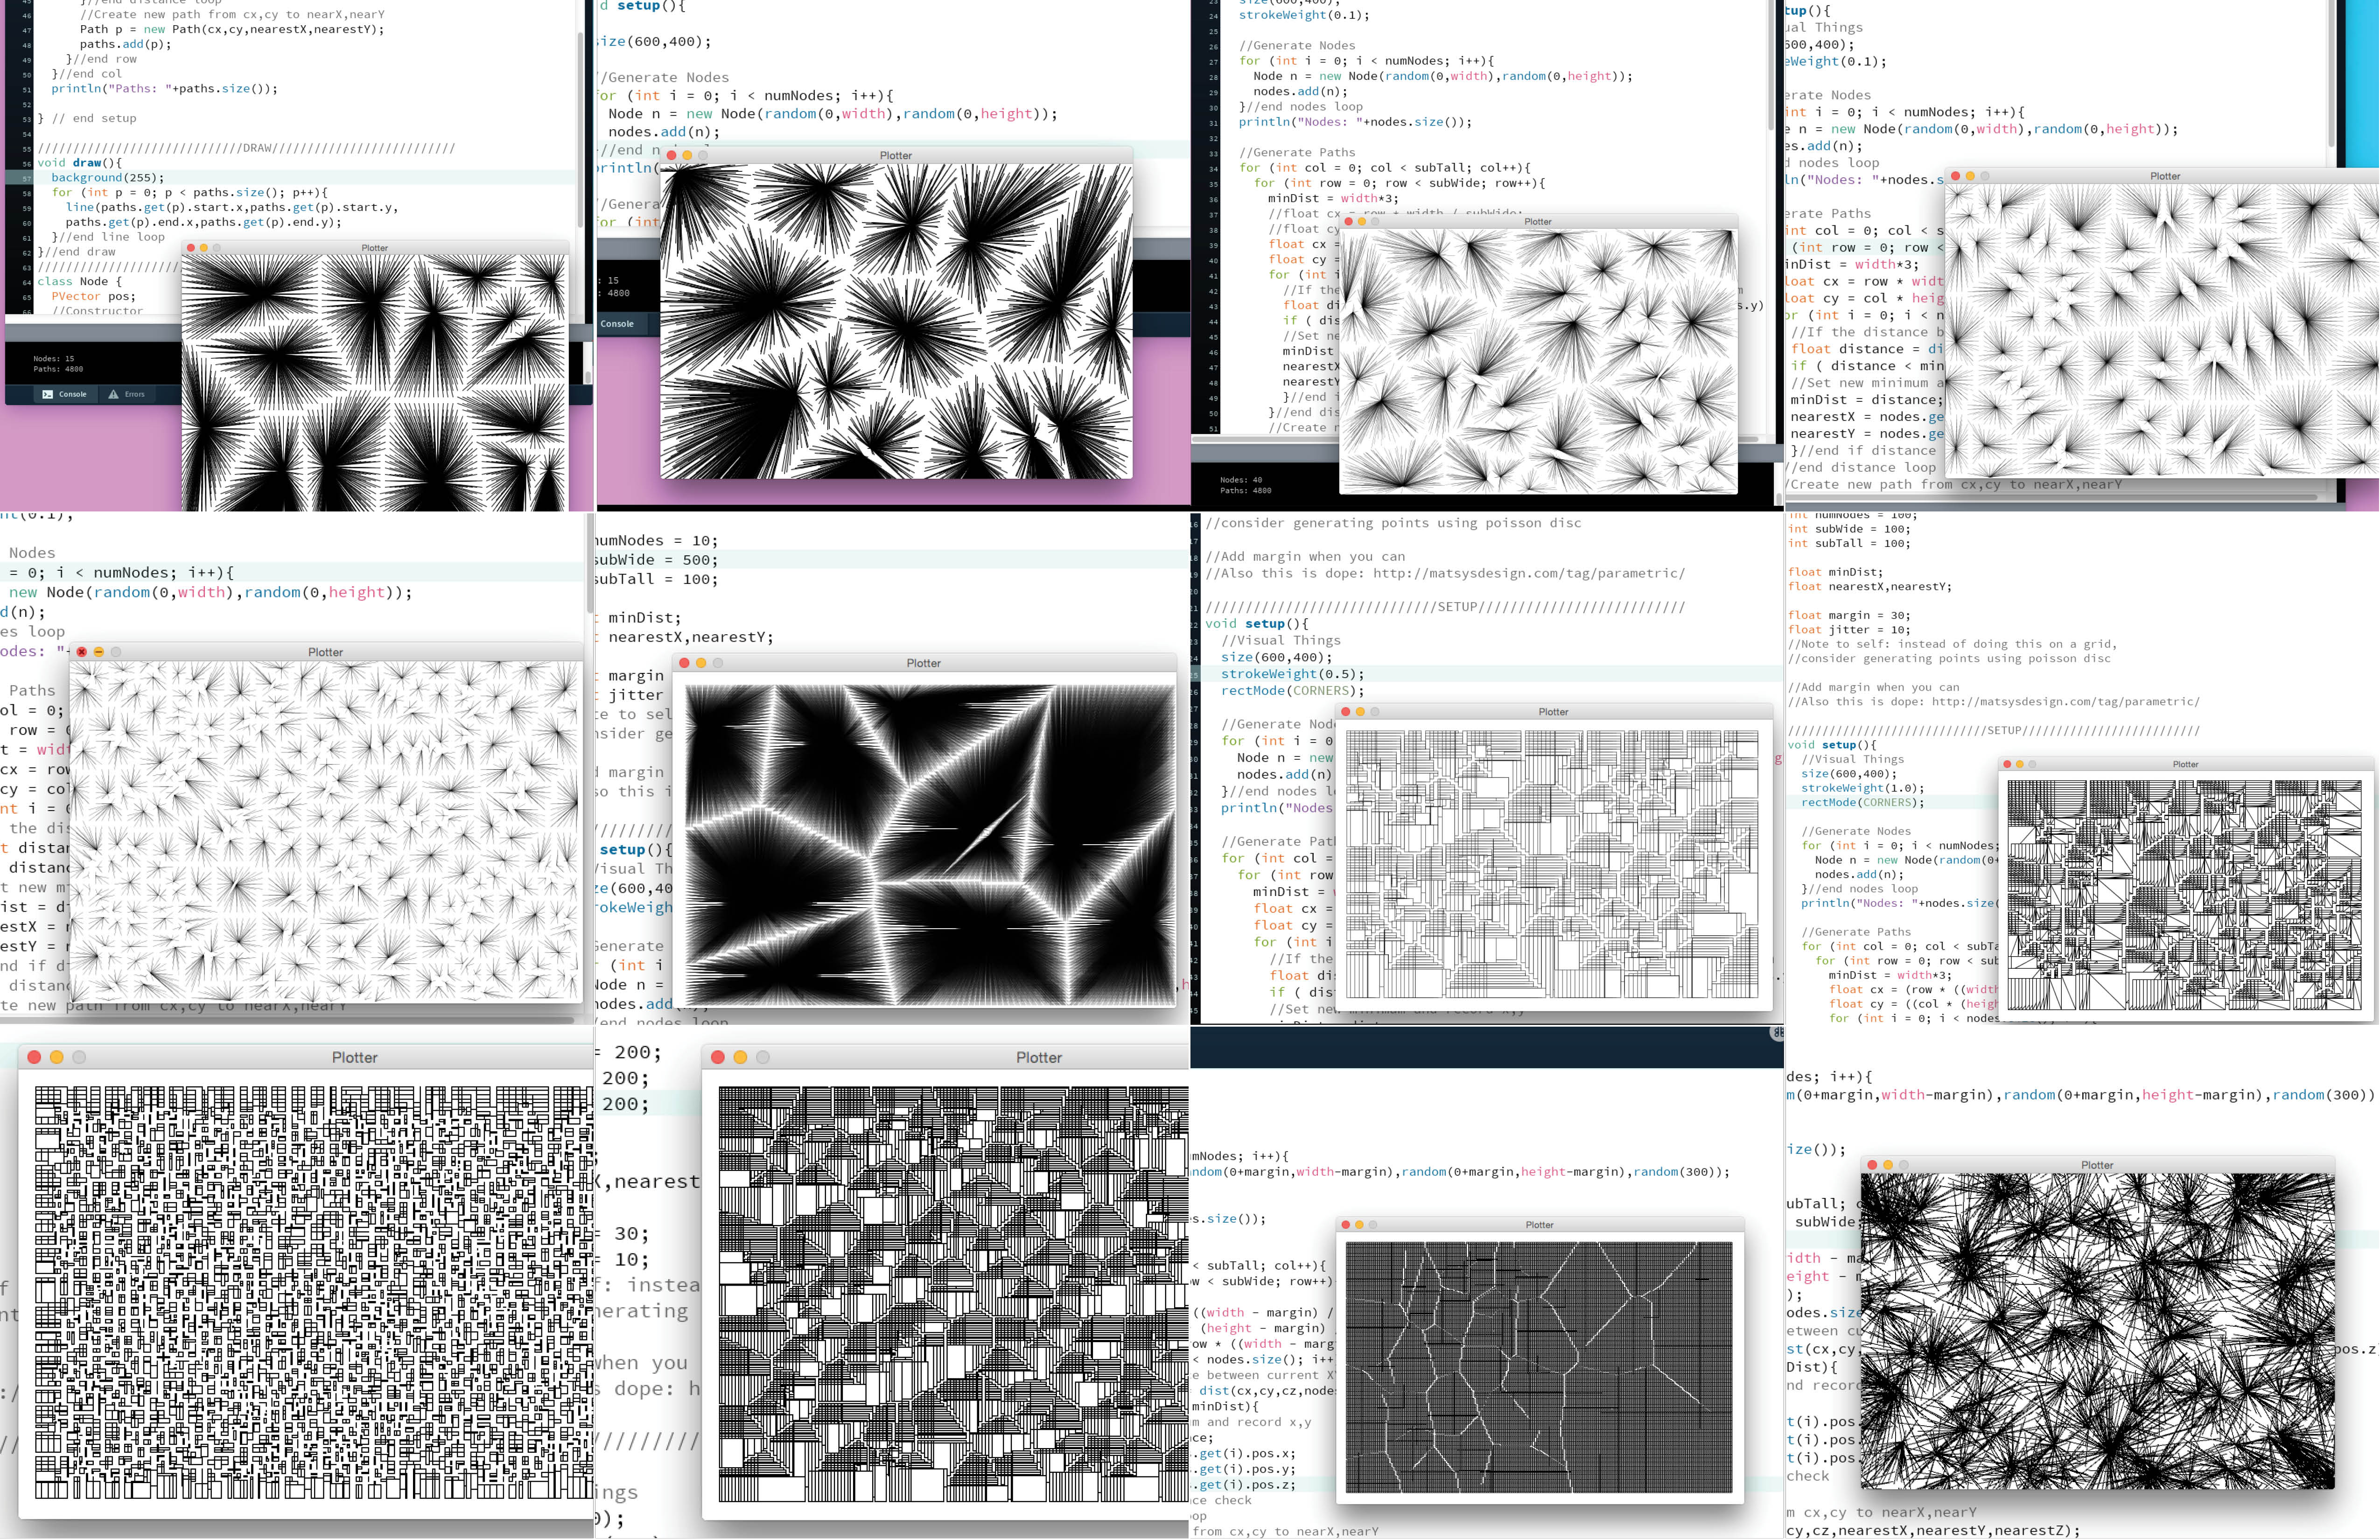
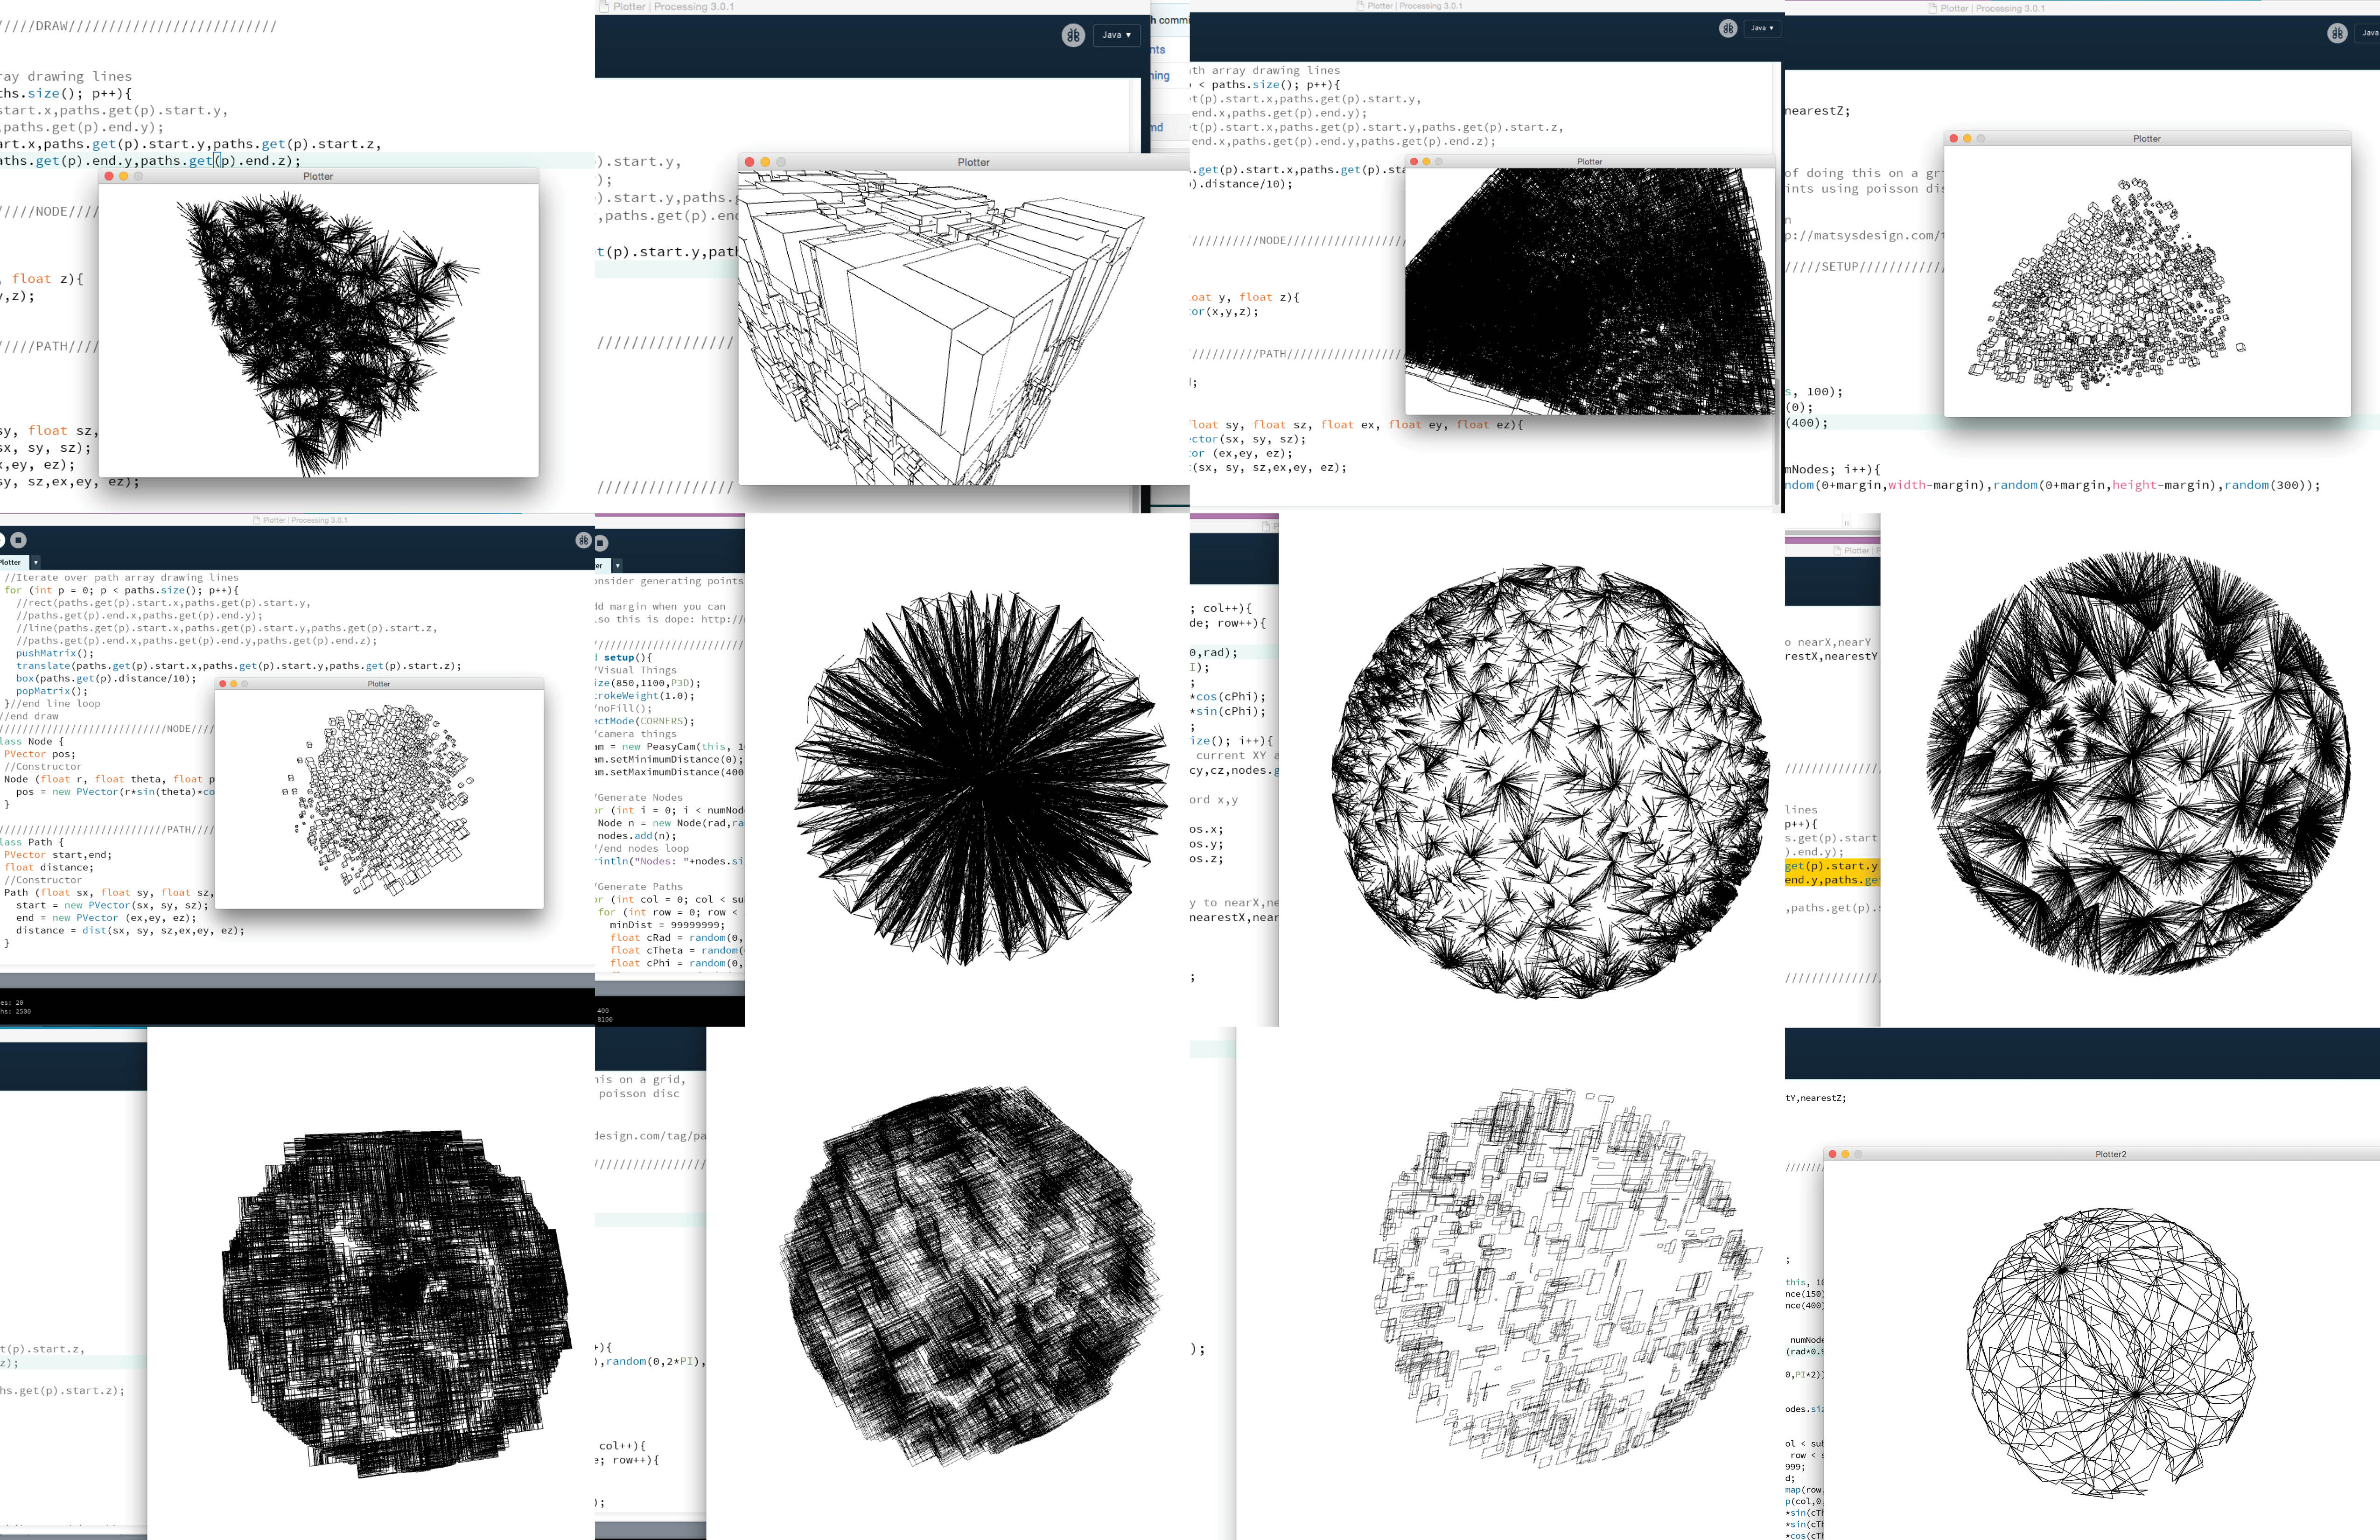
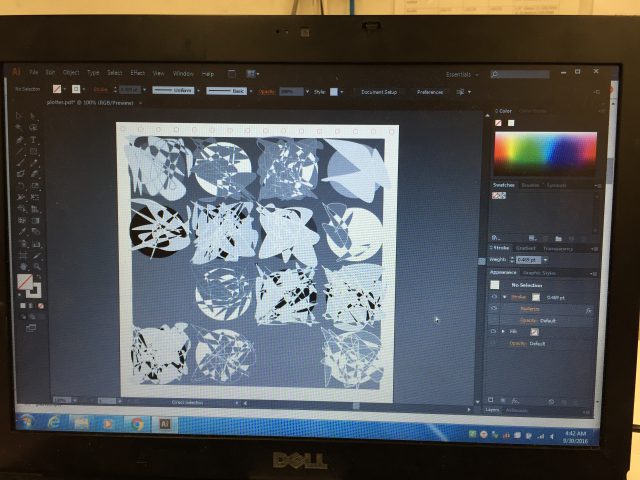
In contrast to my clock project, where I did a lot of drawing in Sketch App to define my design before beginning to code, with this project, I jumped into Processing almost right away. I did this to ’embrace the symptom’ and let the limitations of the tool guide my way through the design problem.
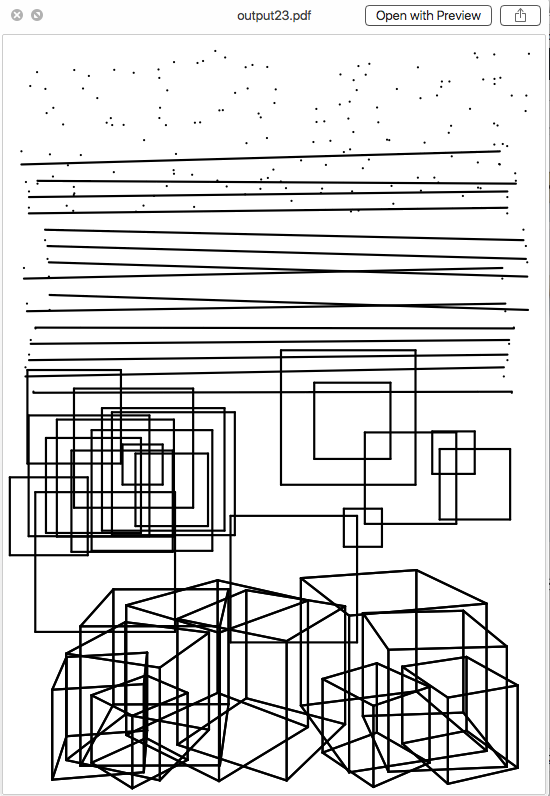
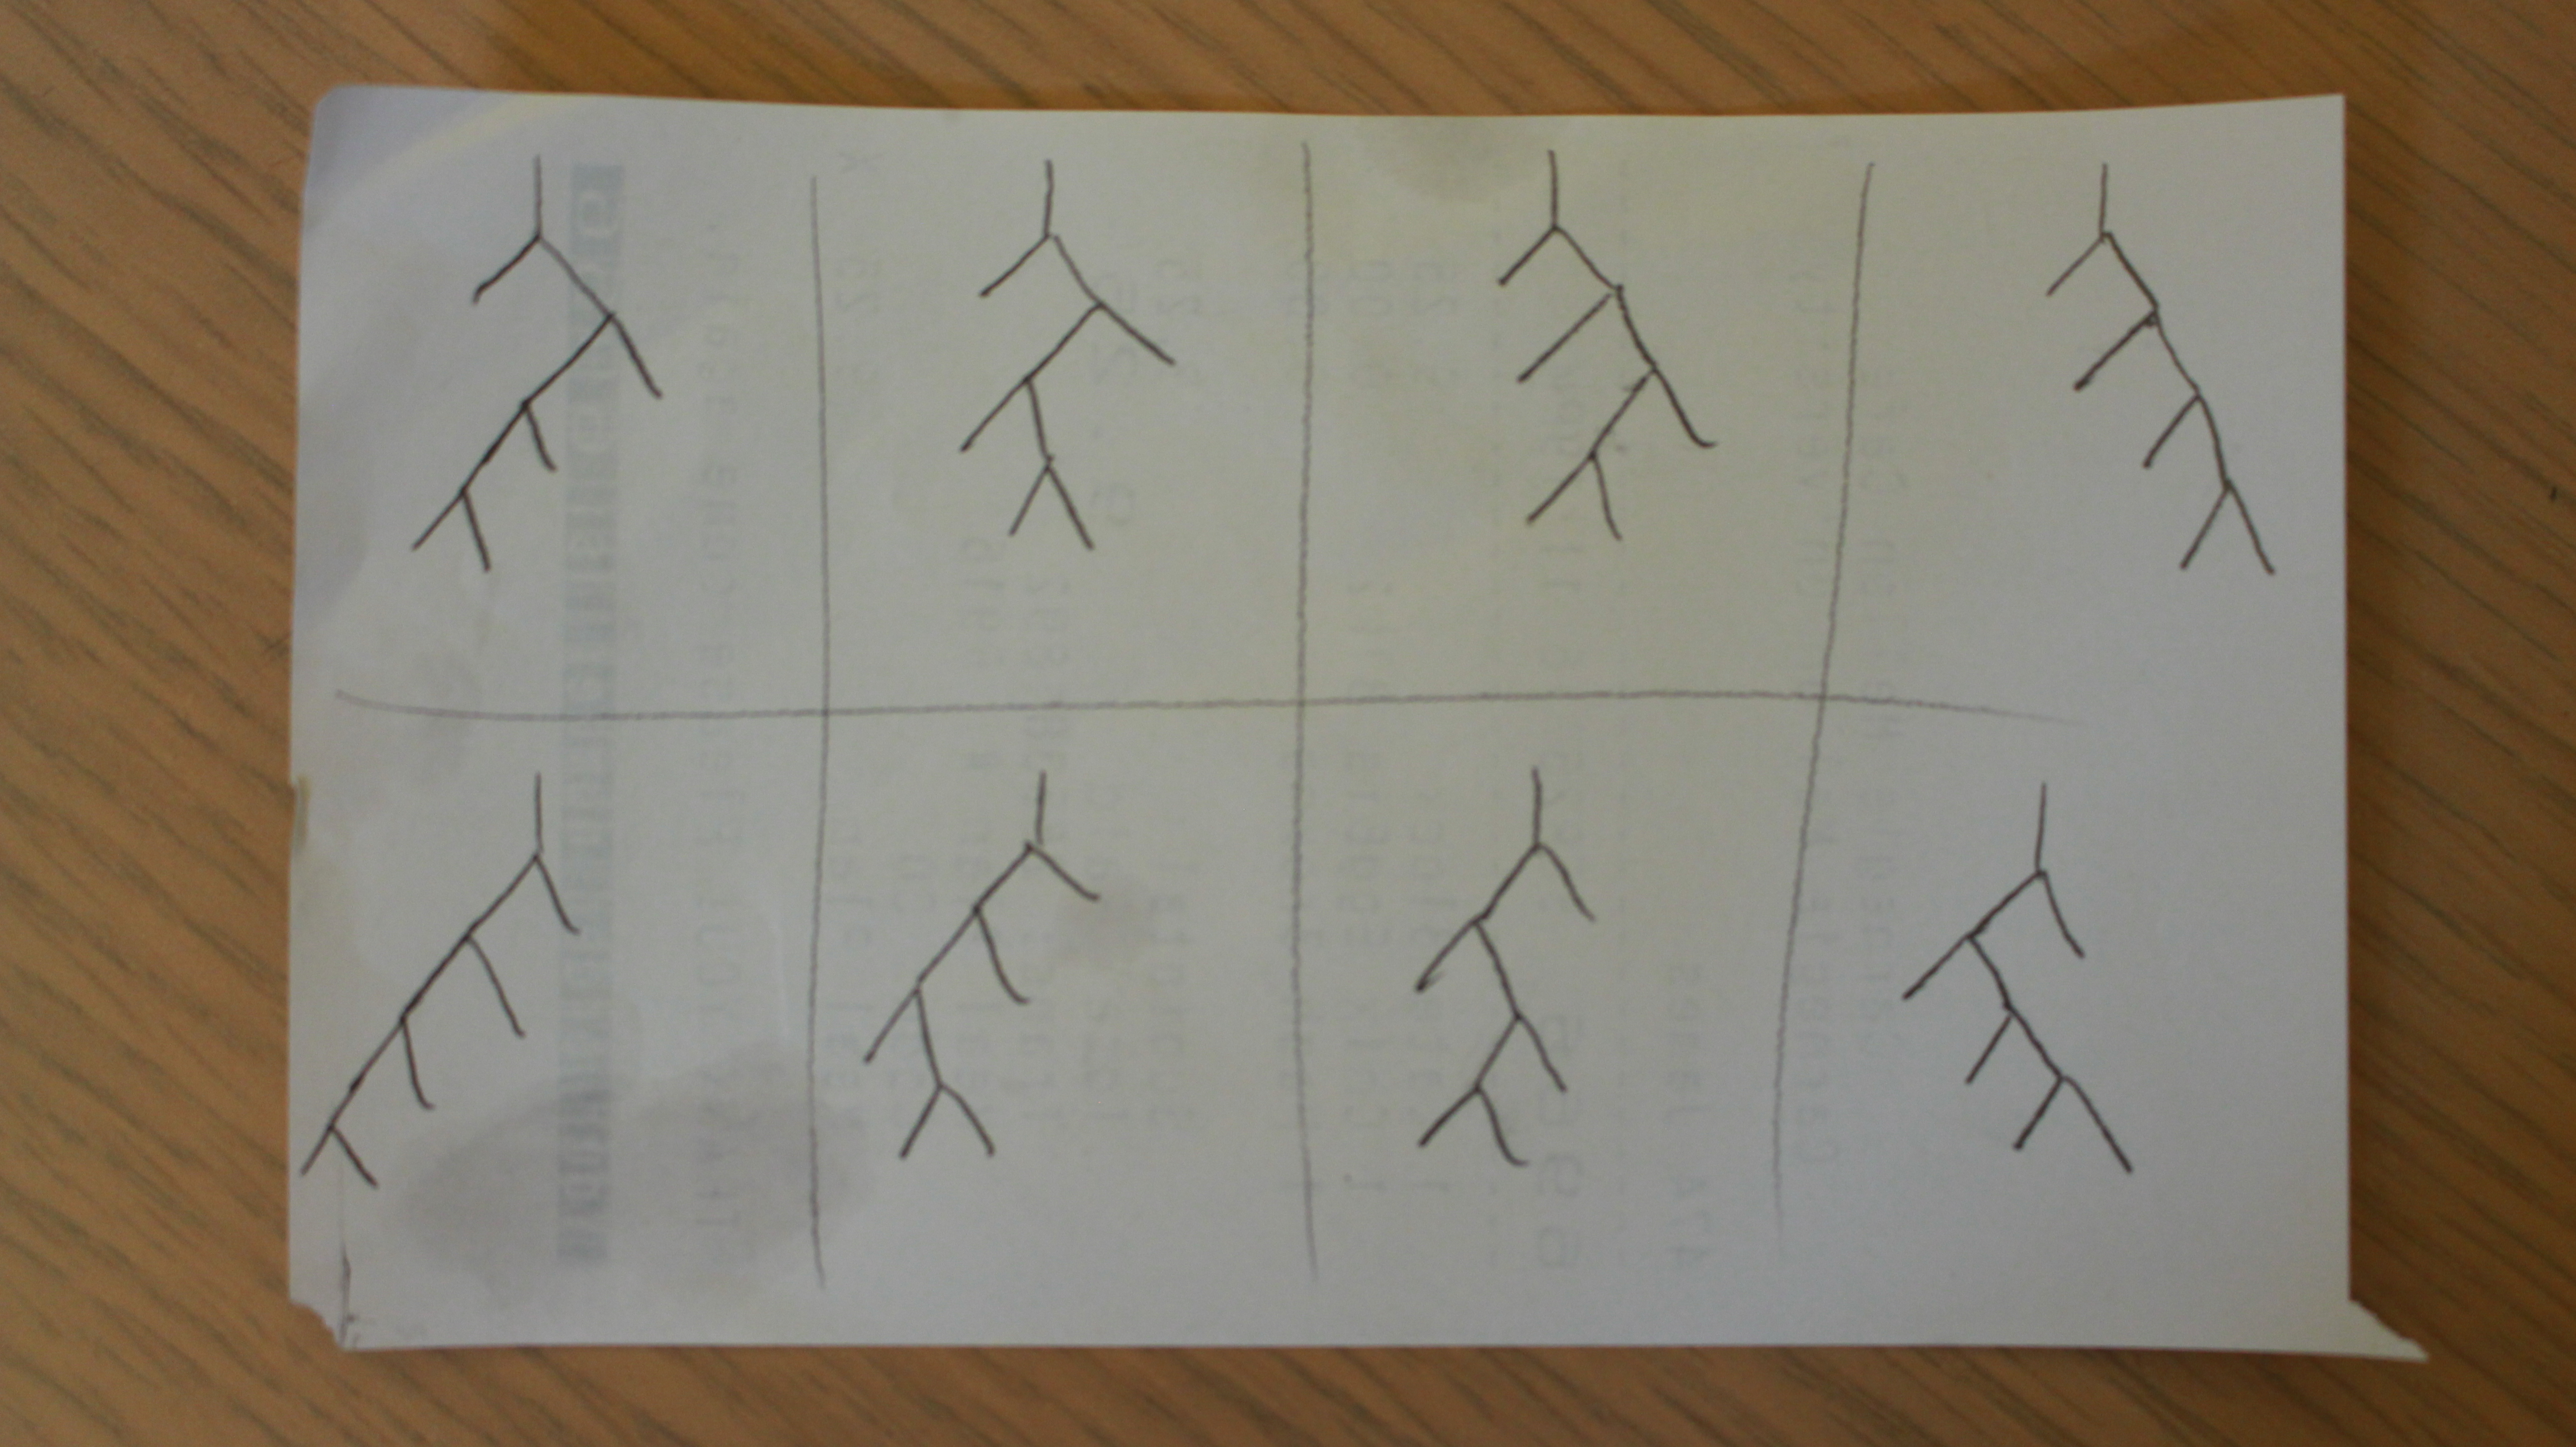
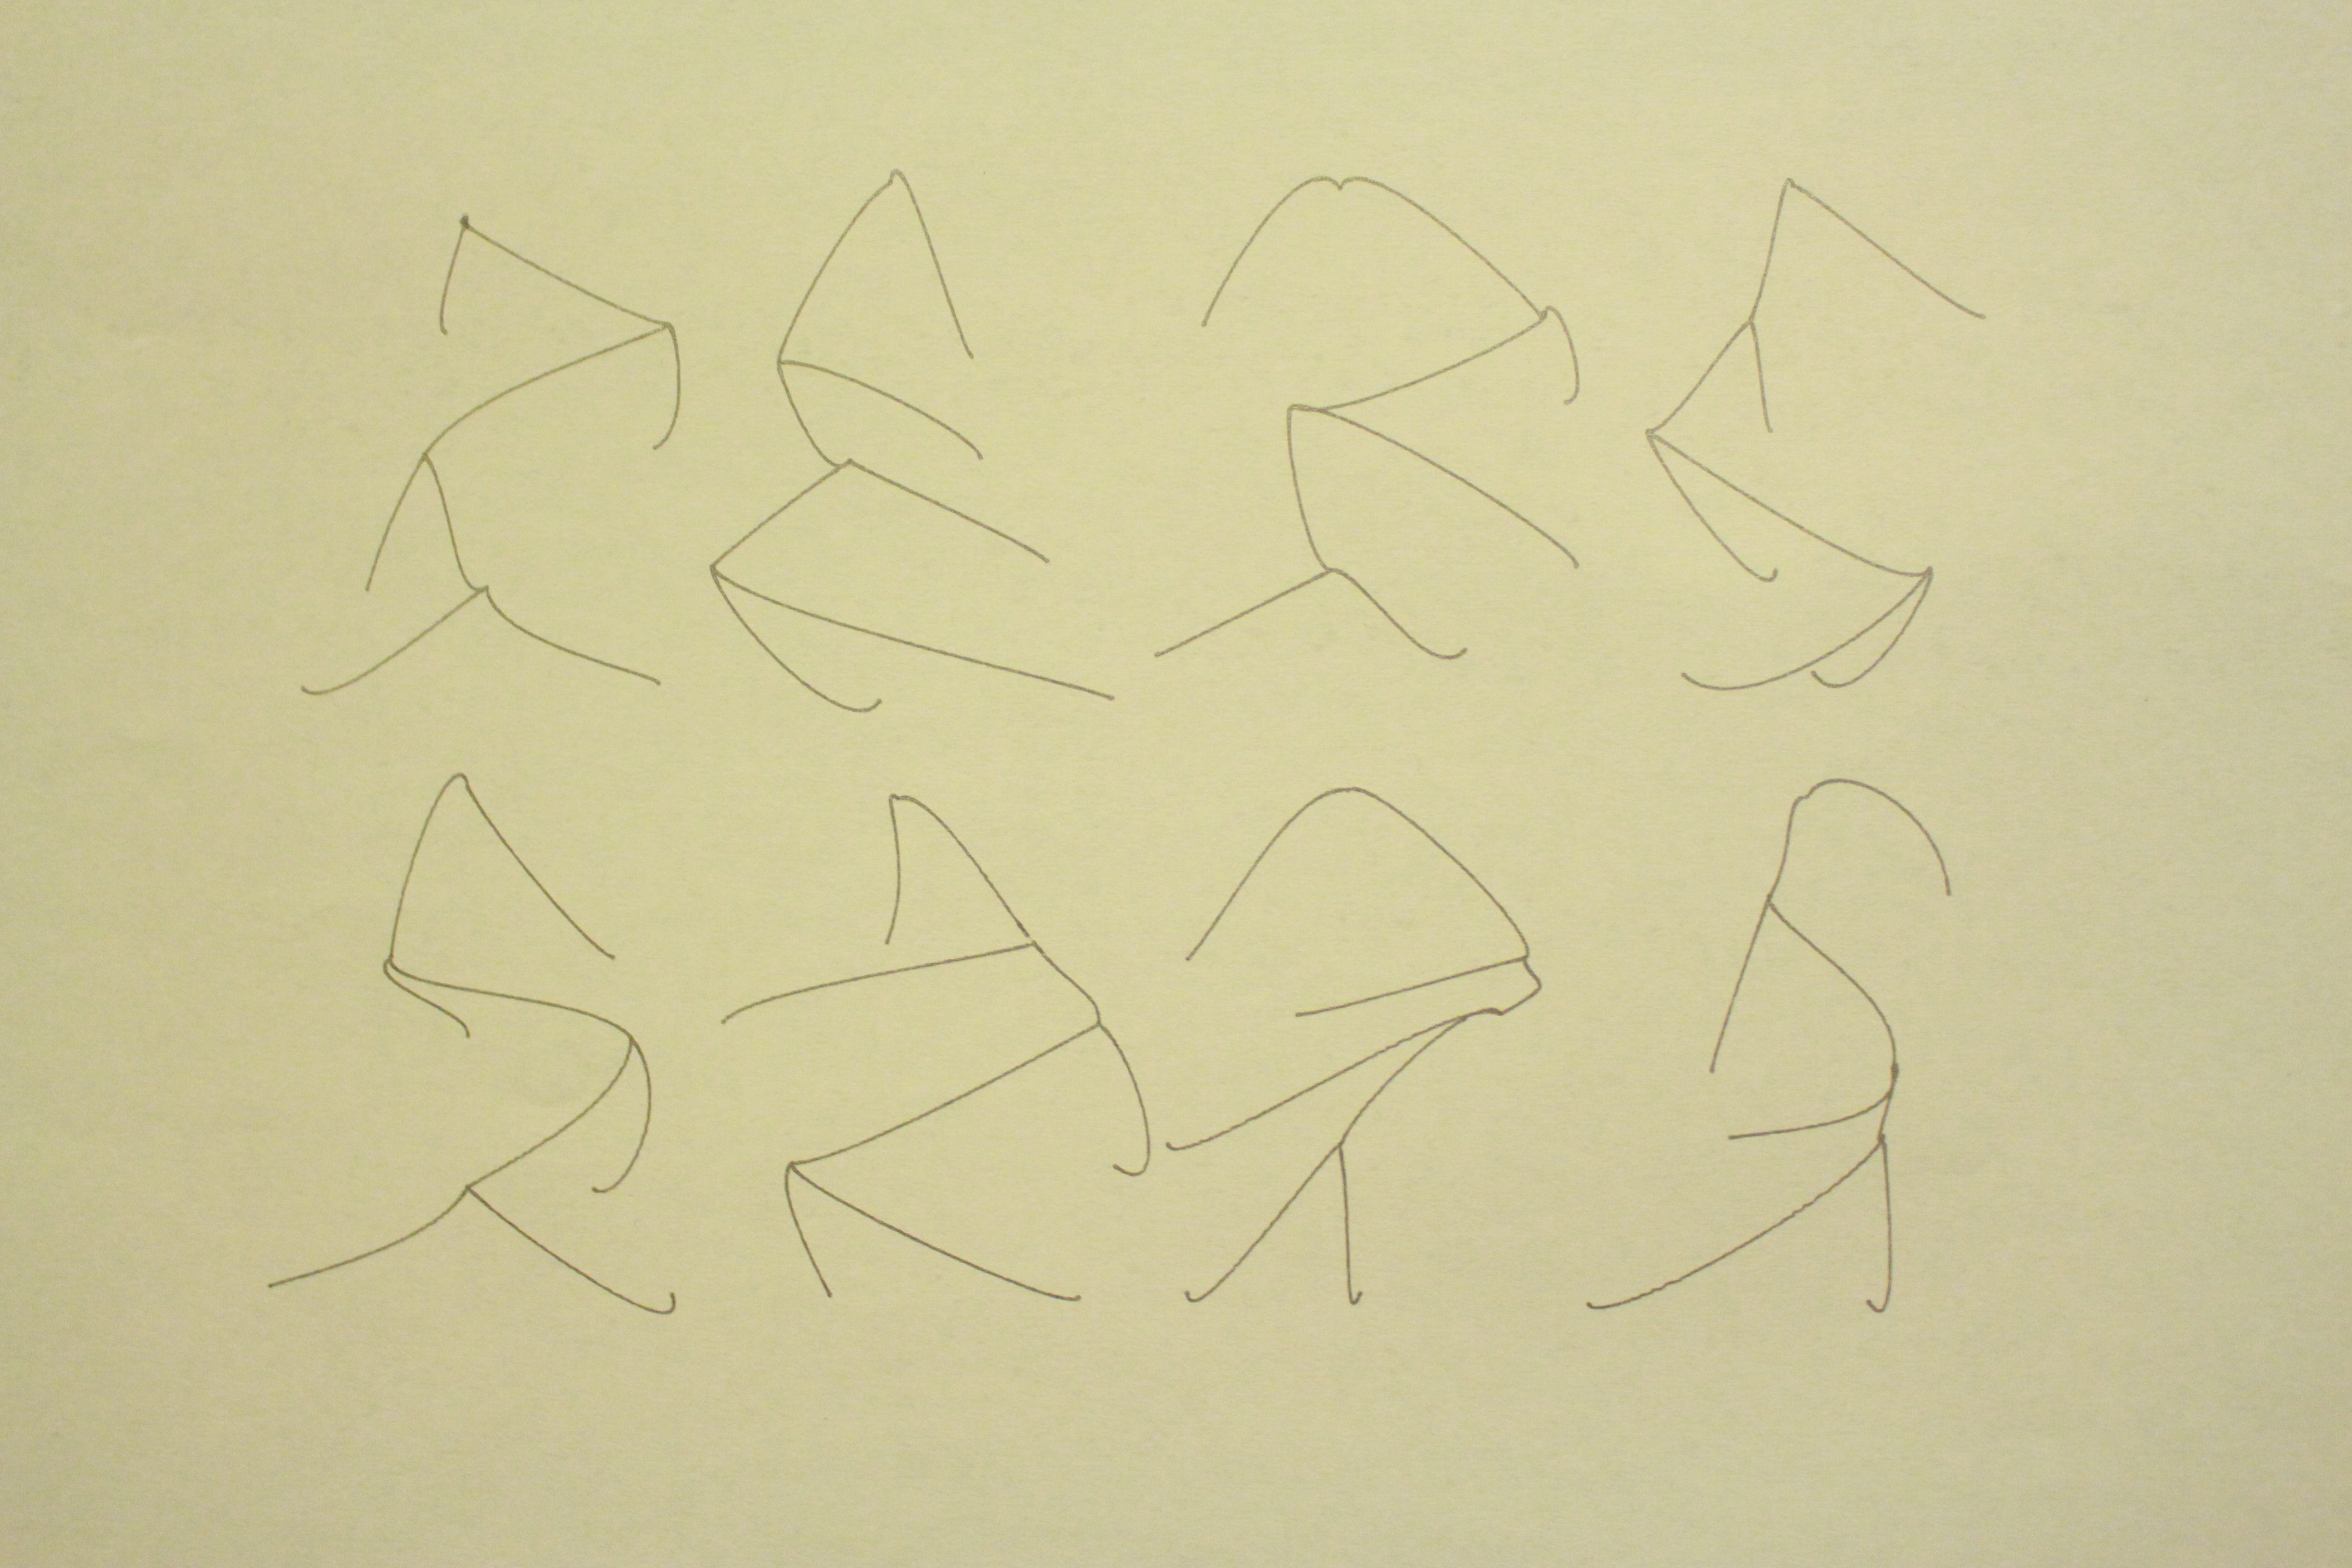
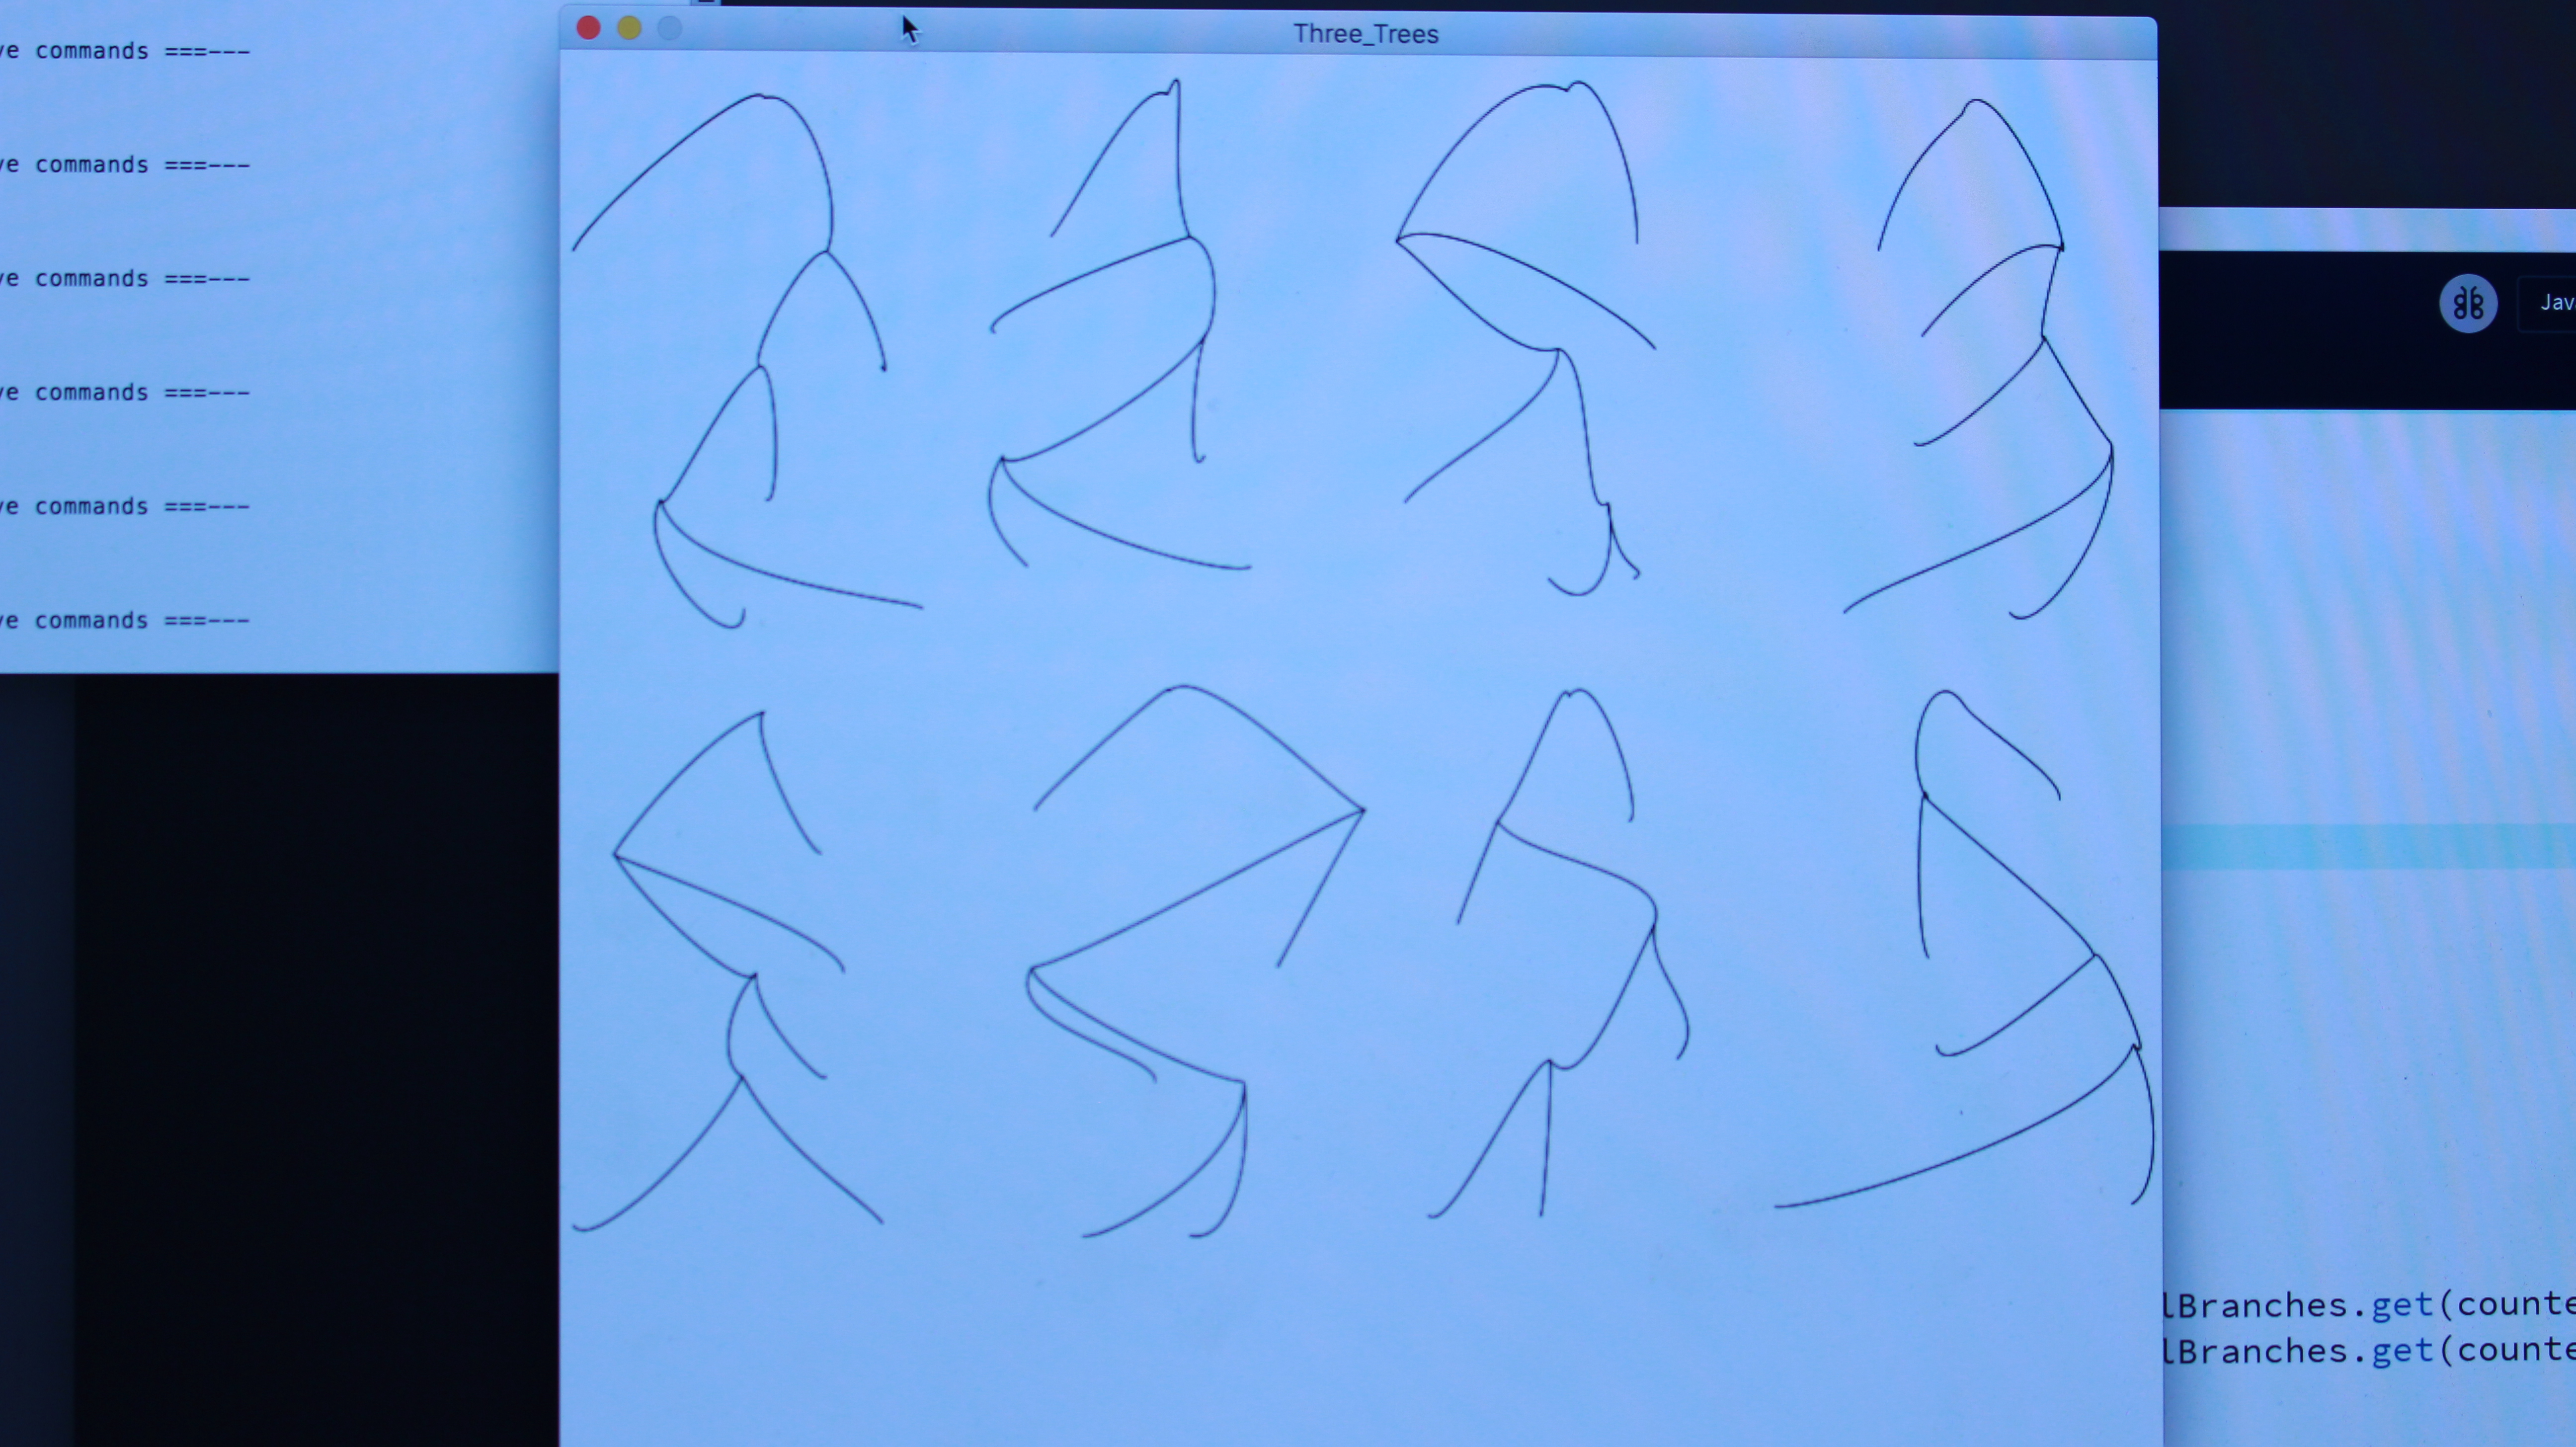
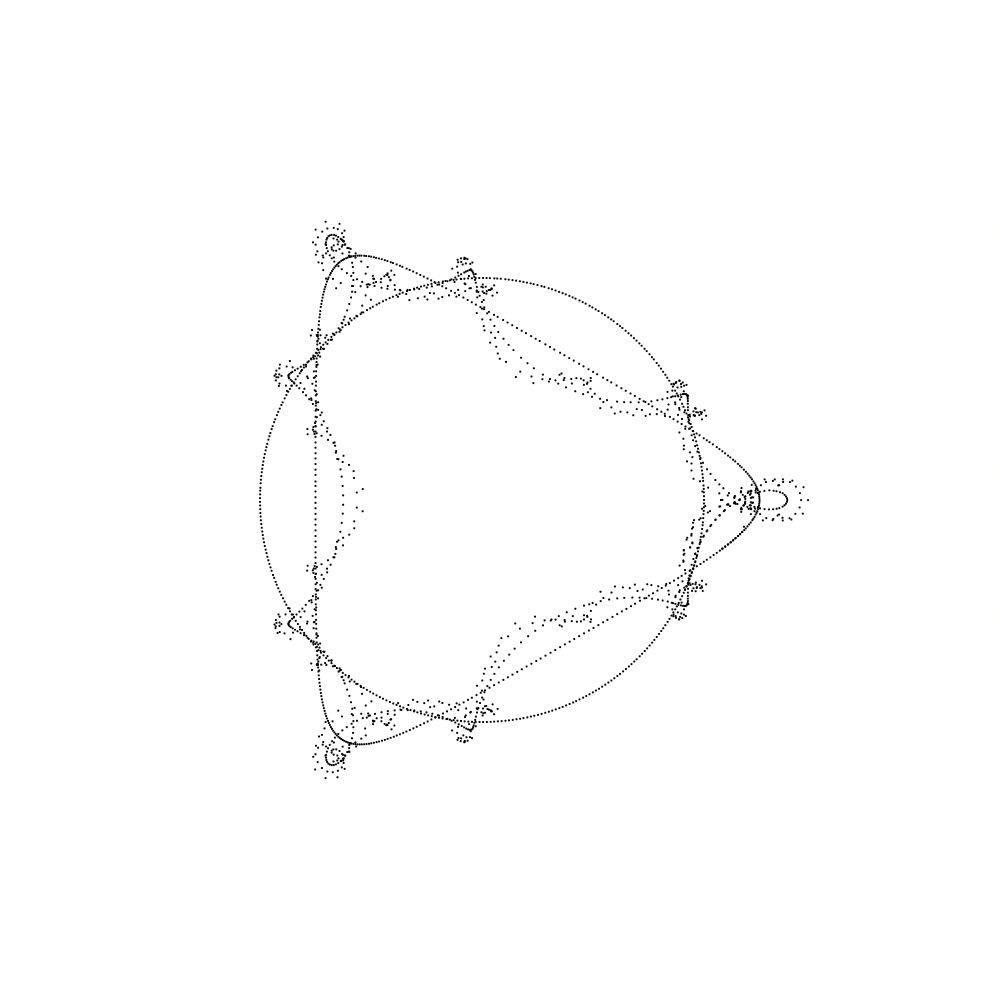
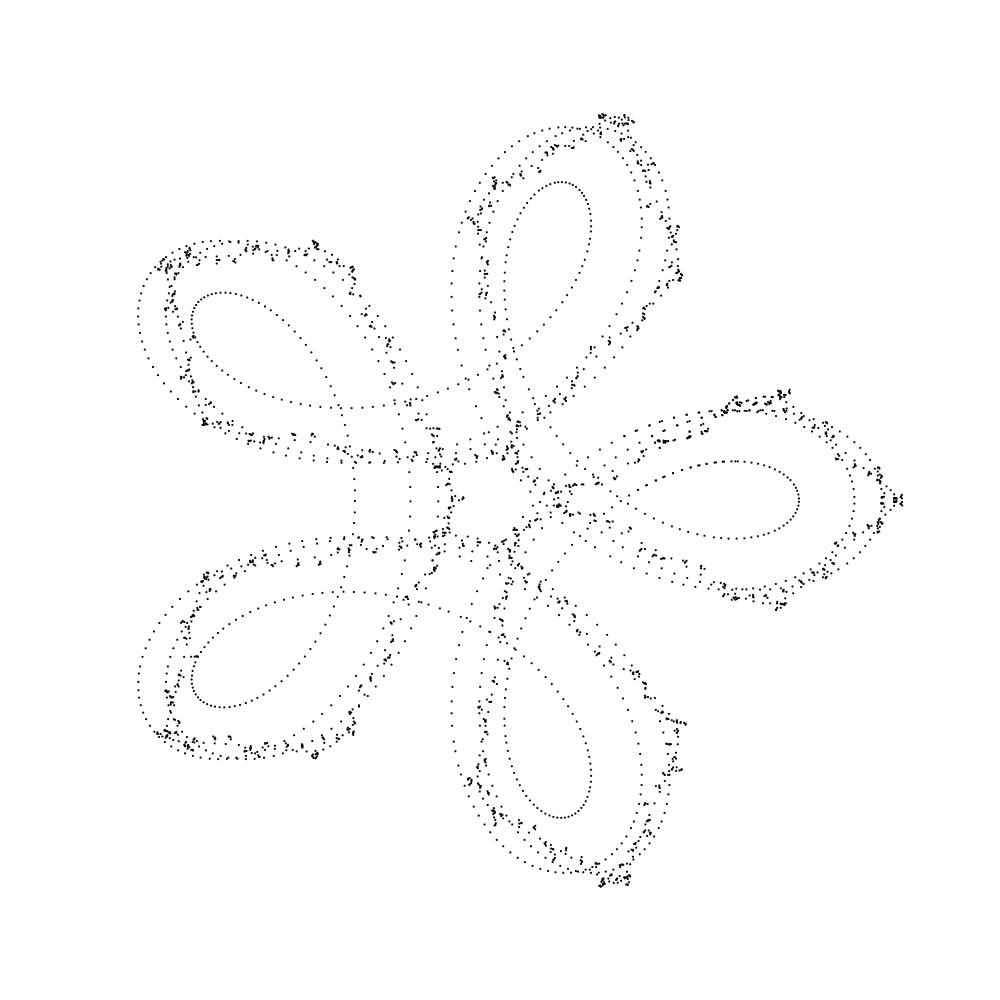
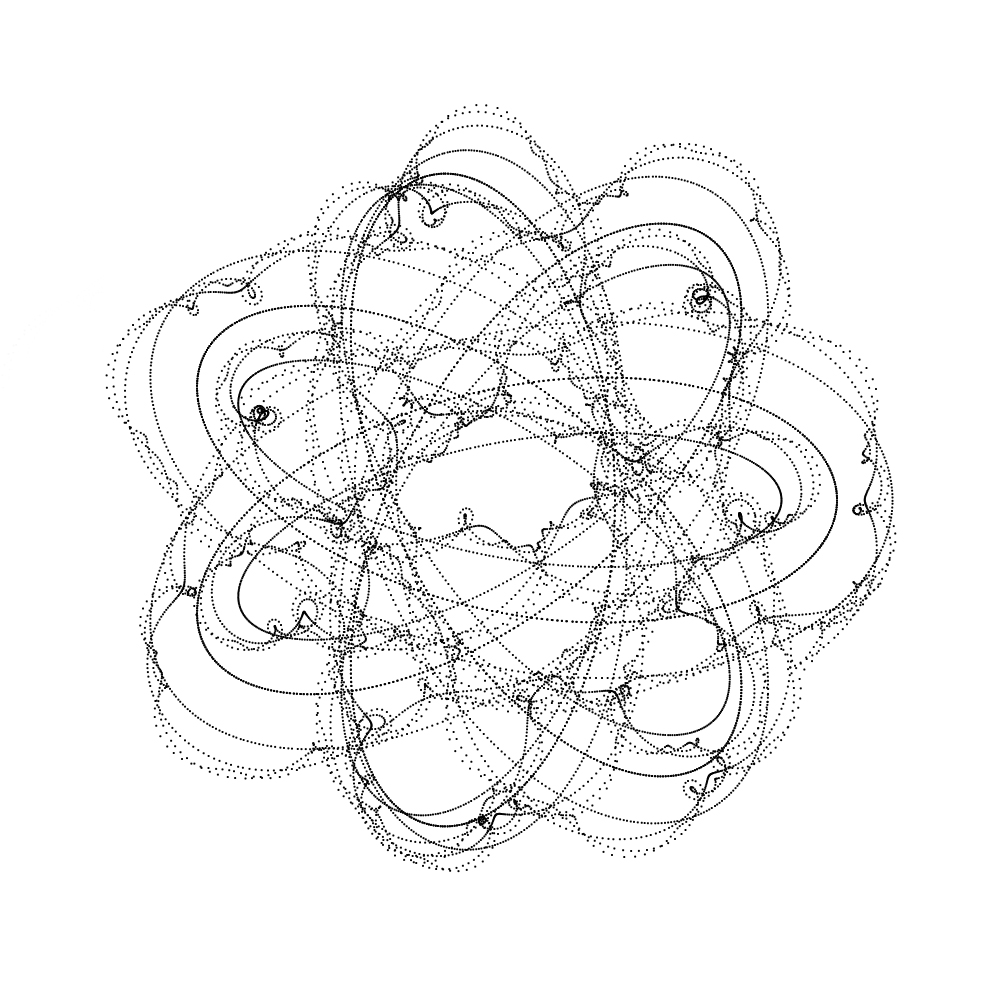
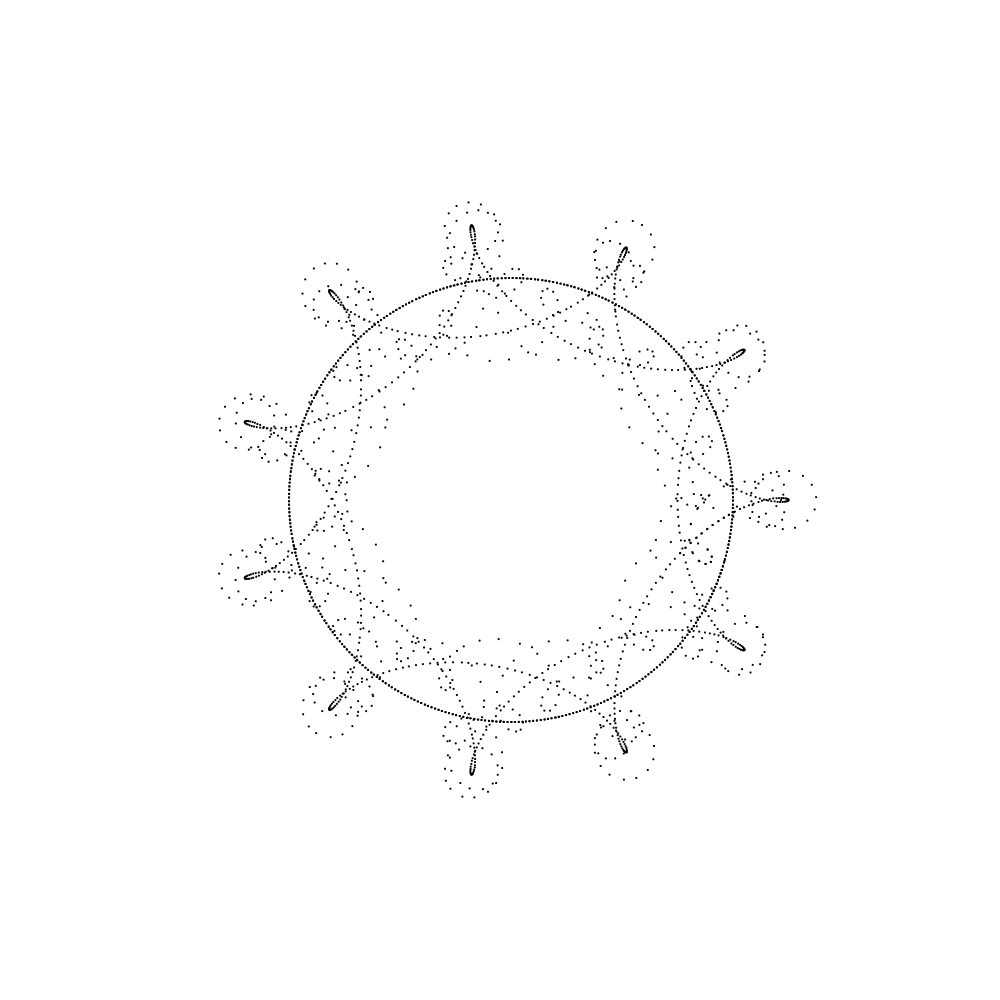
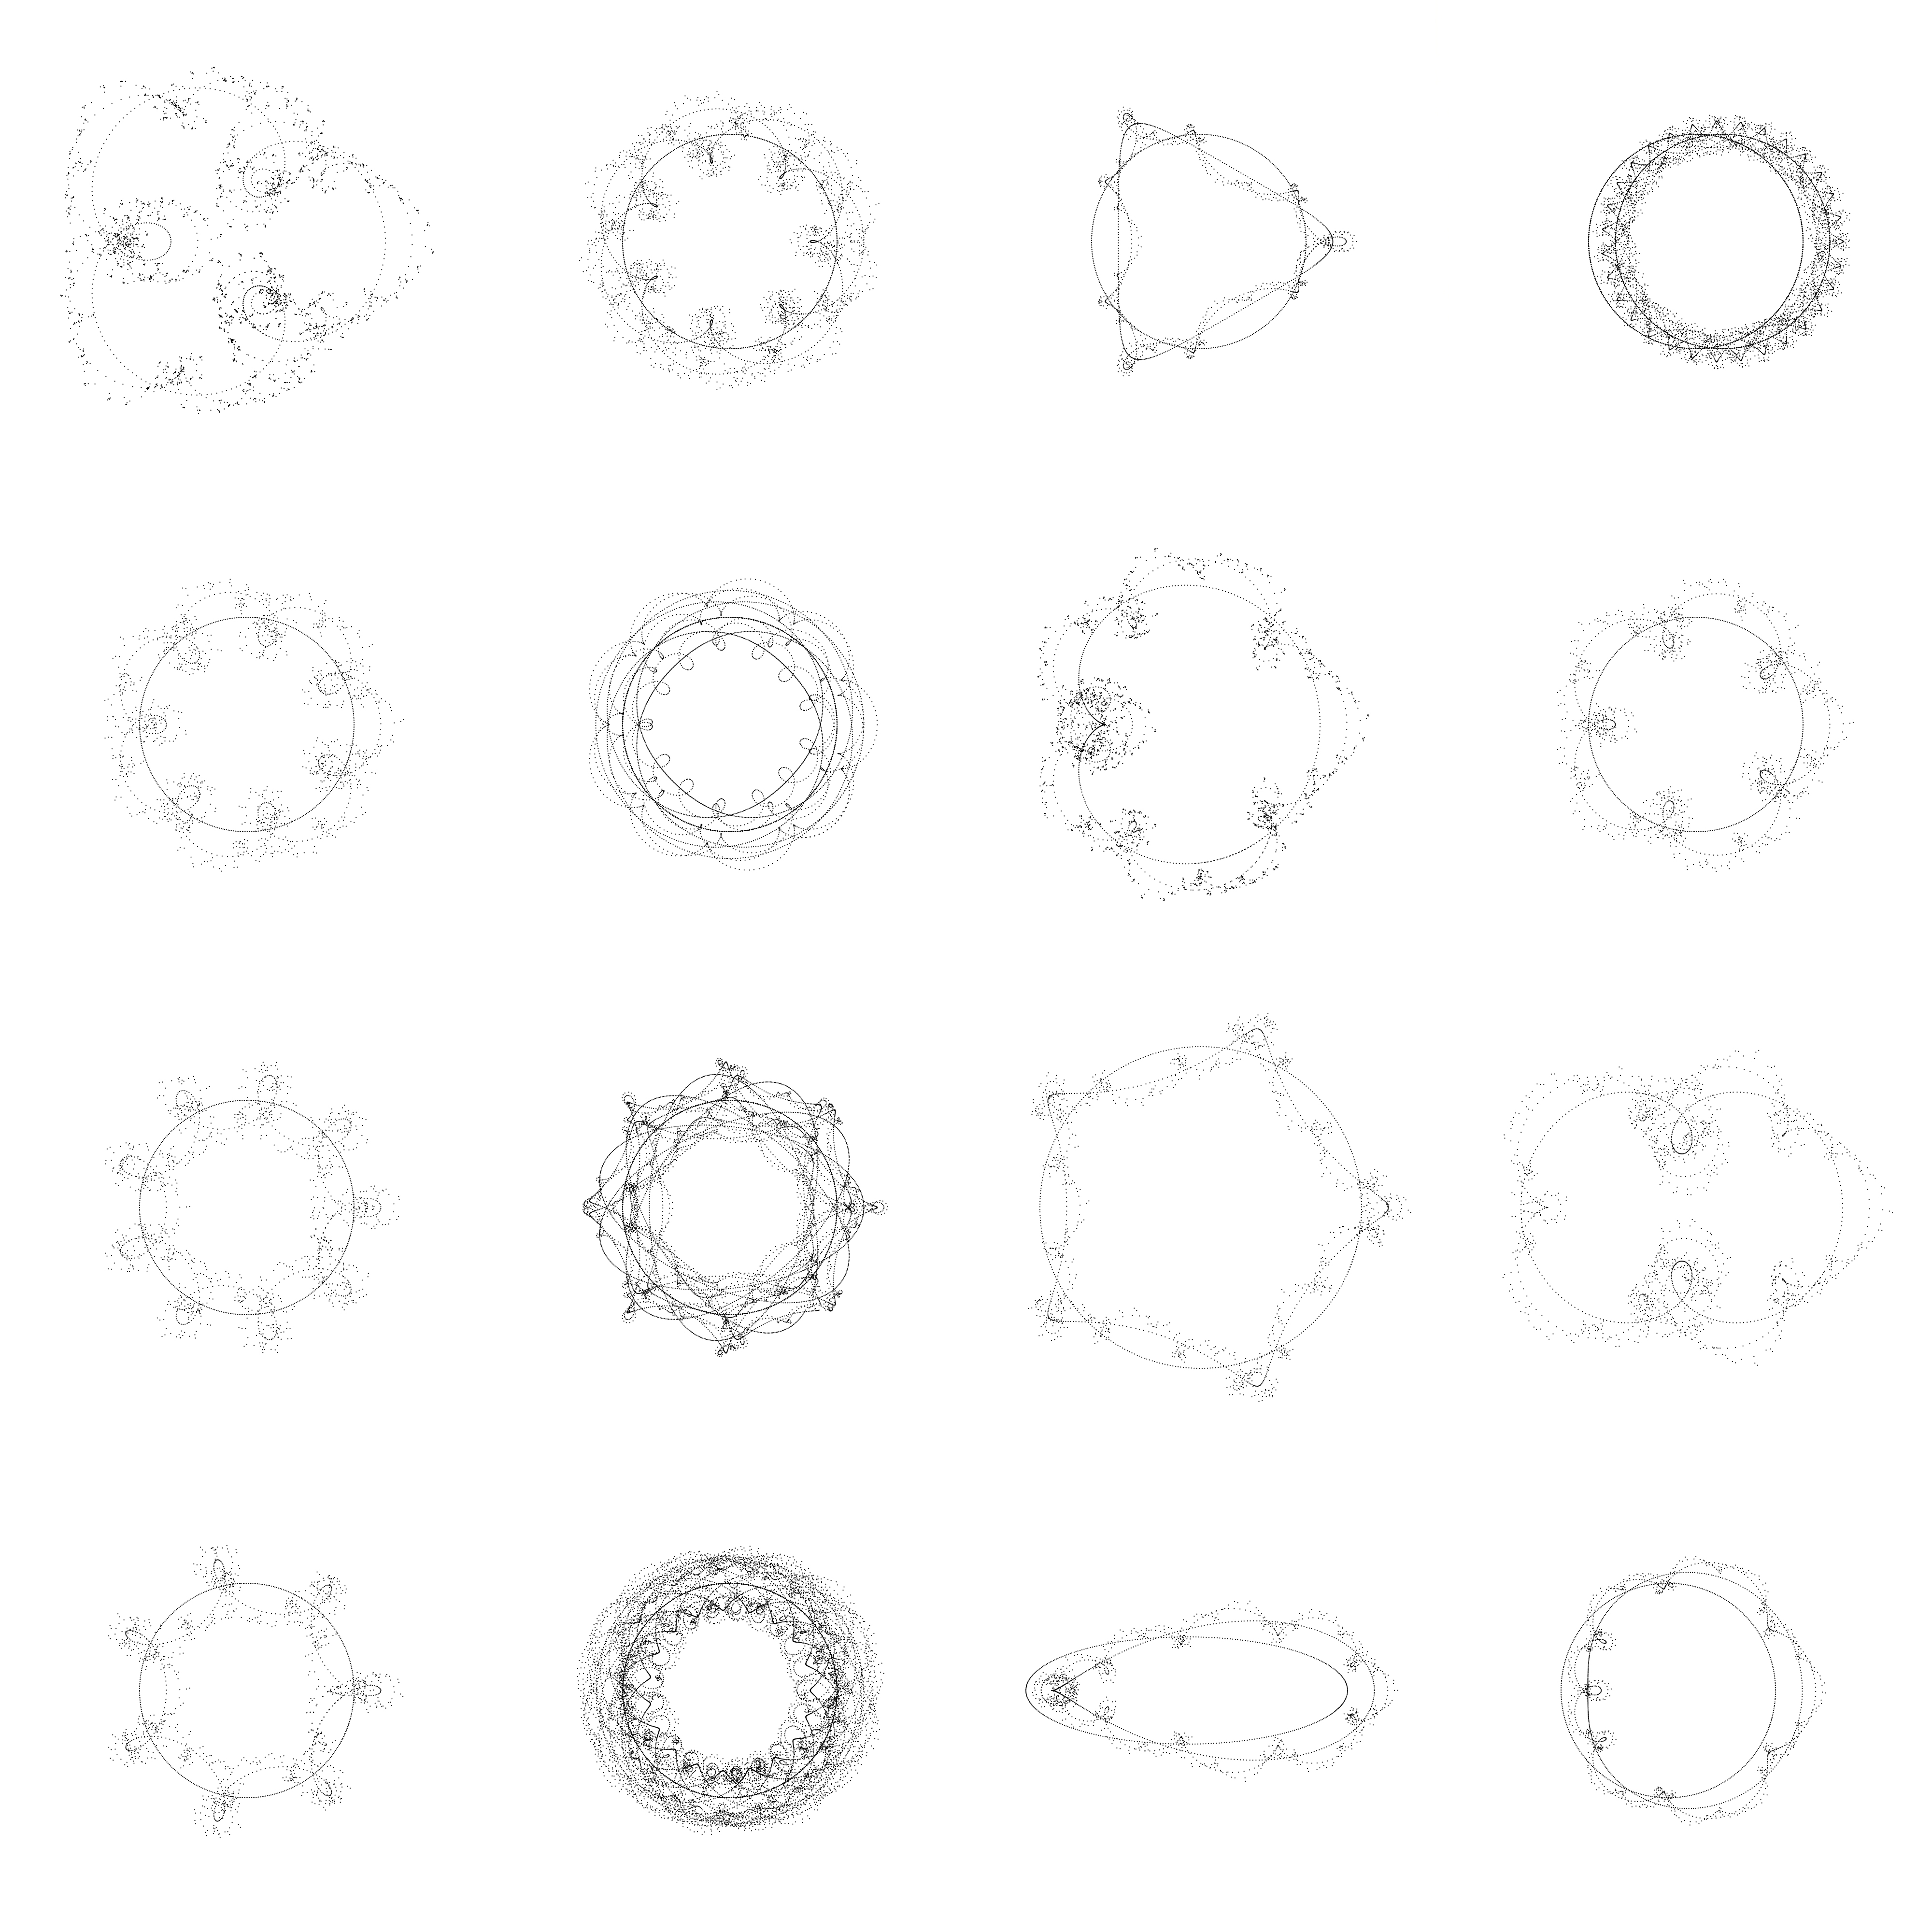
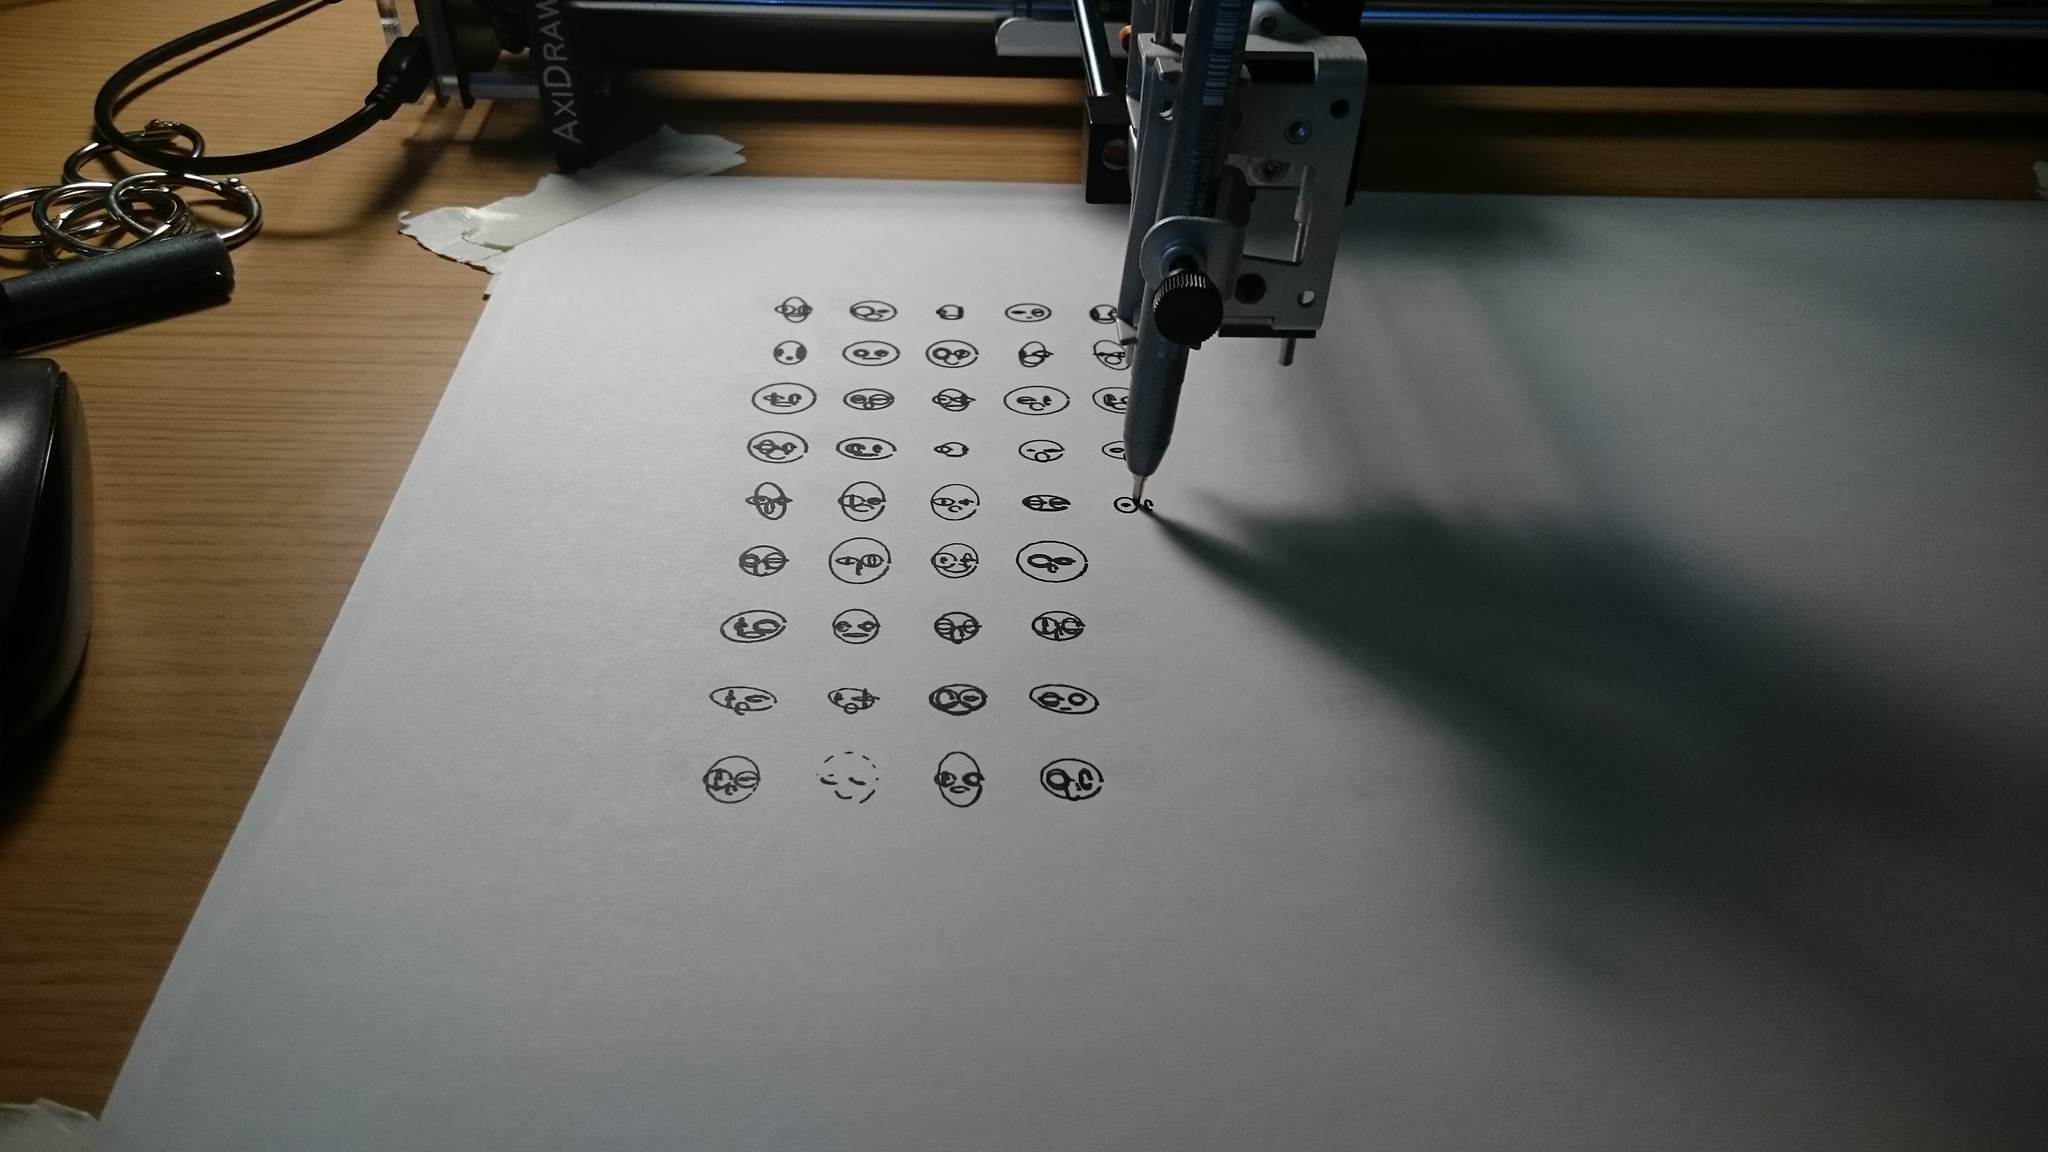
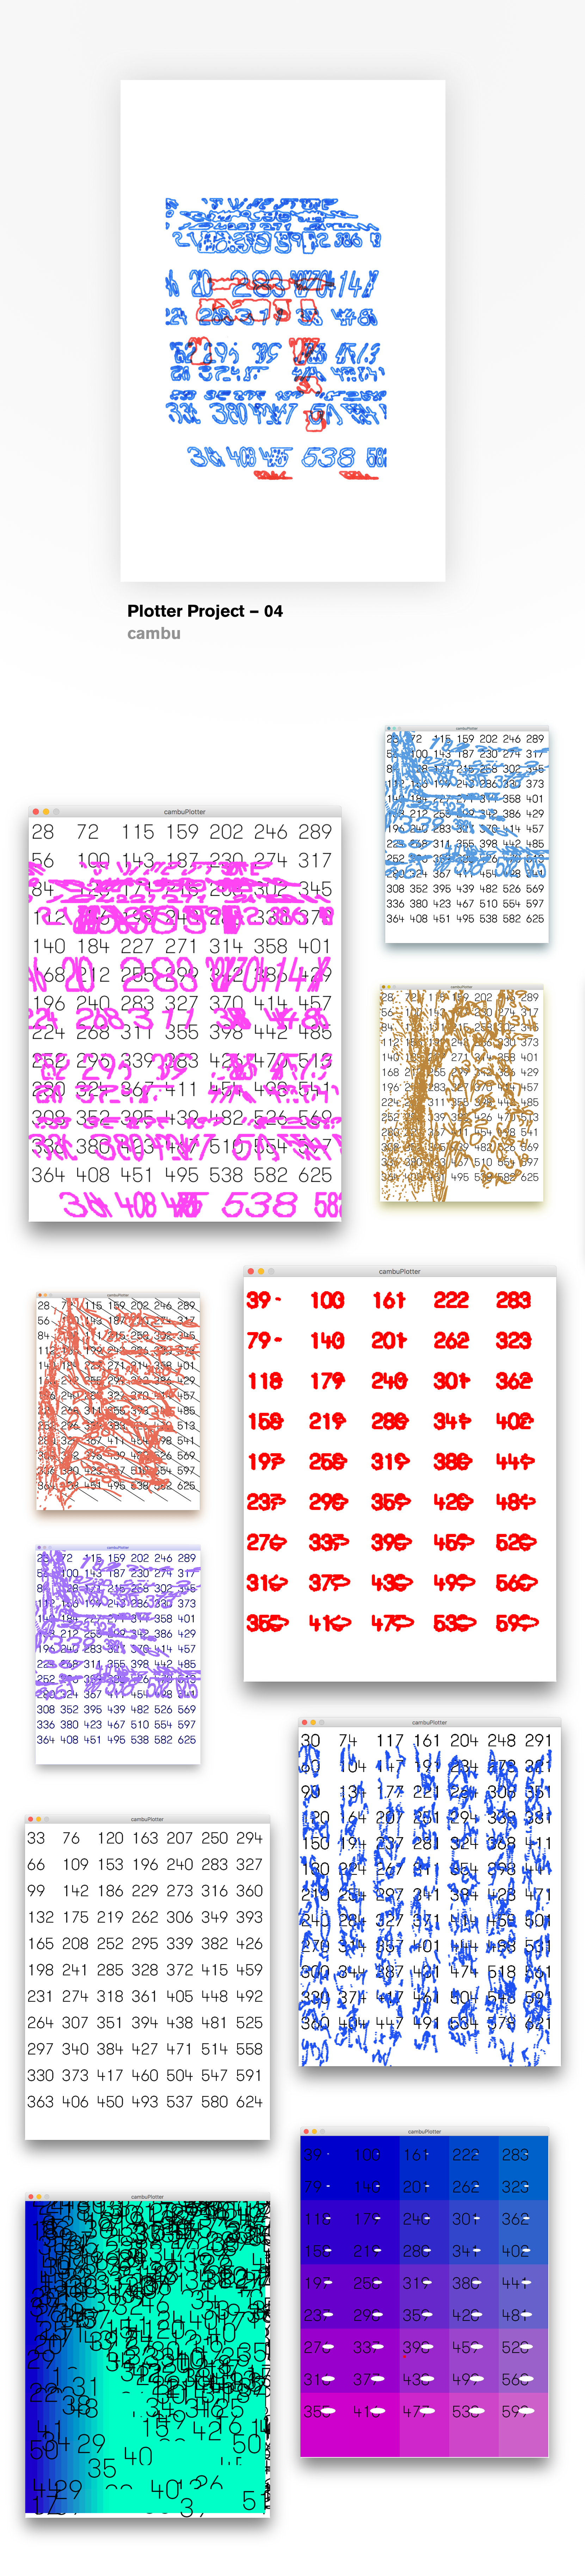
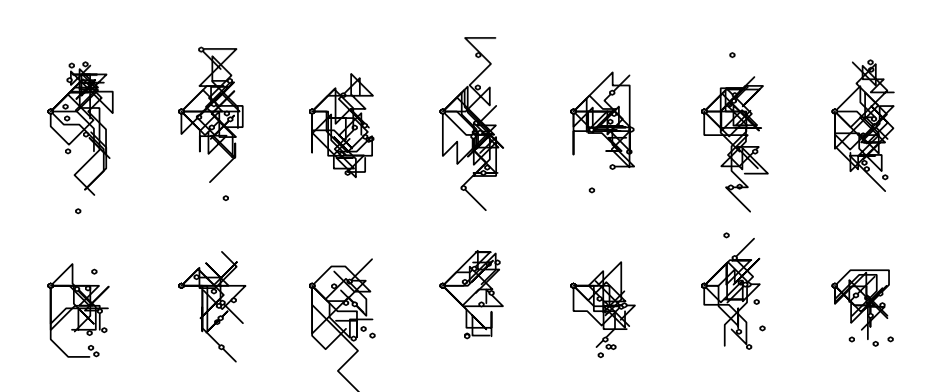
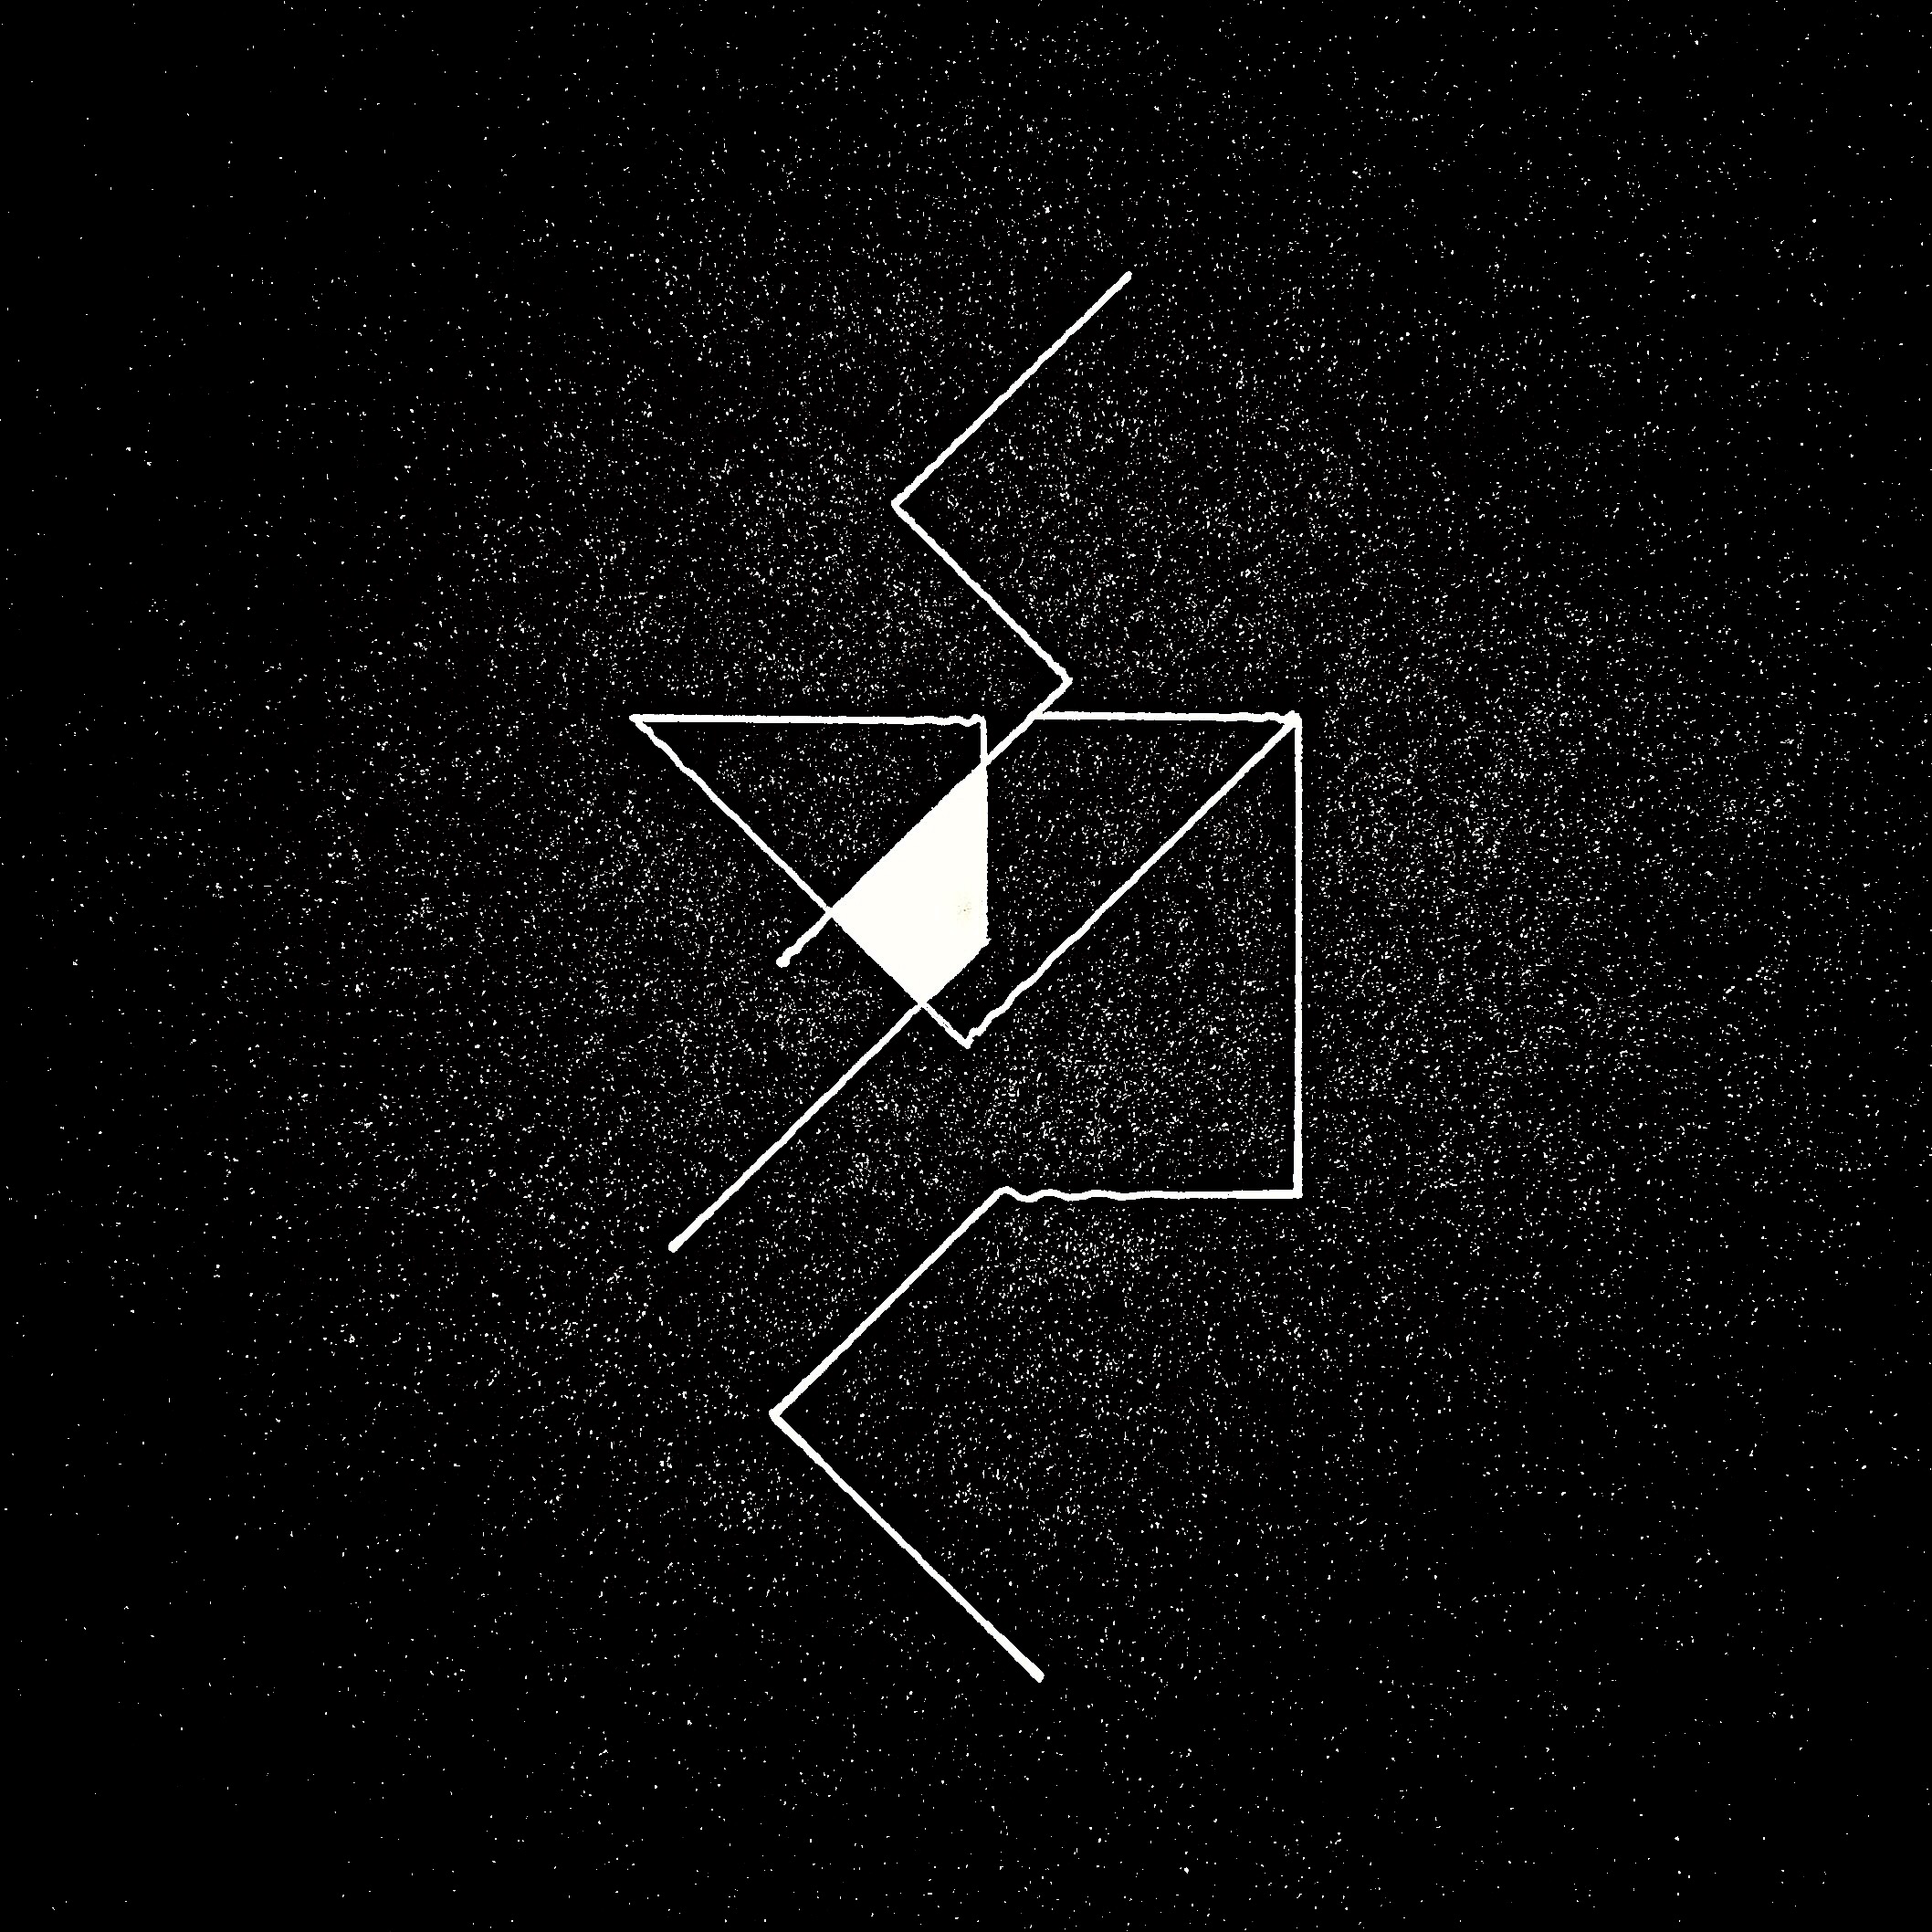
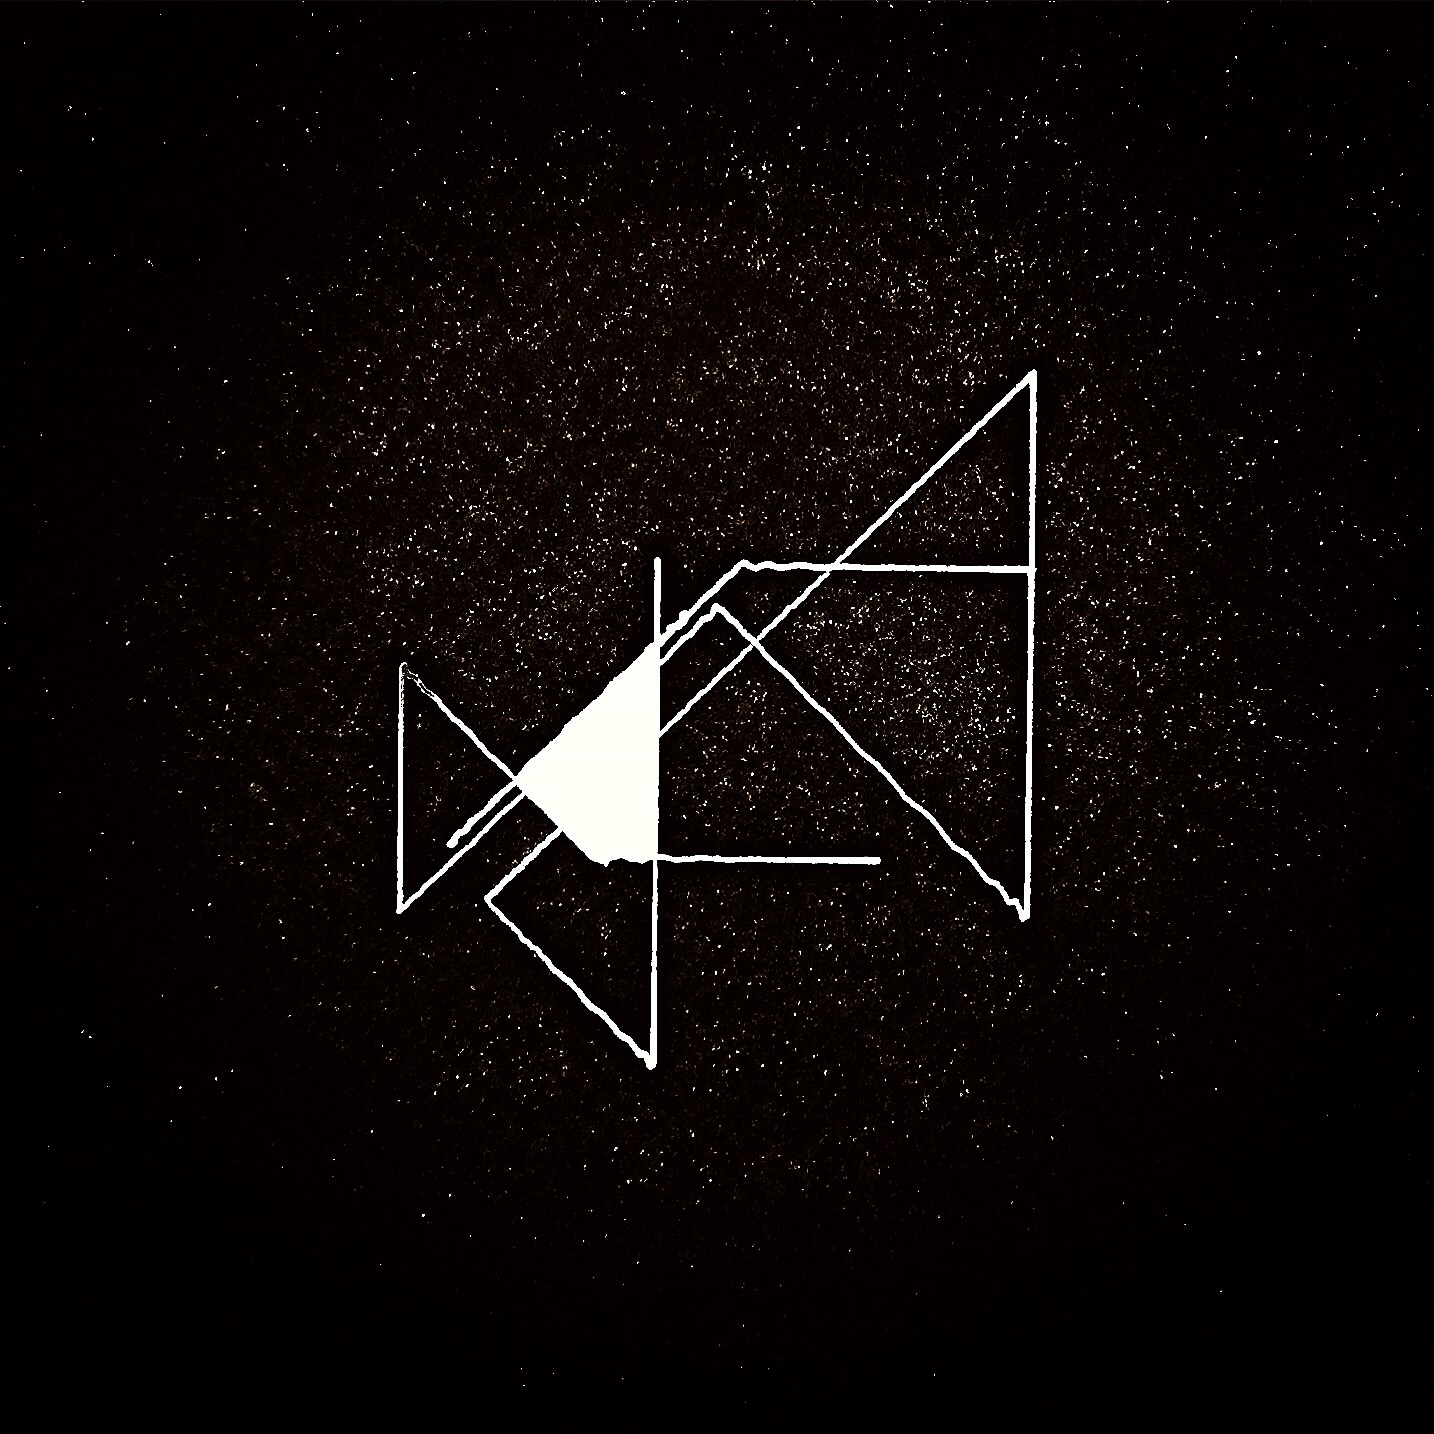
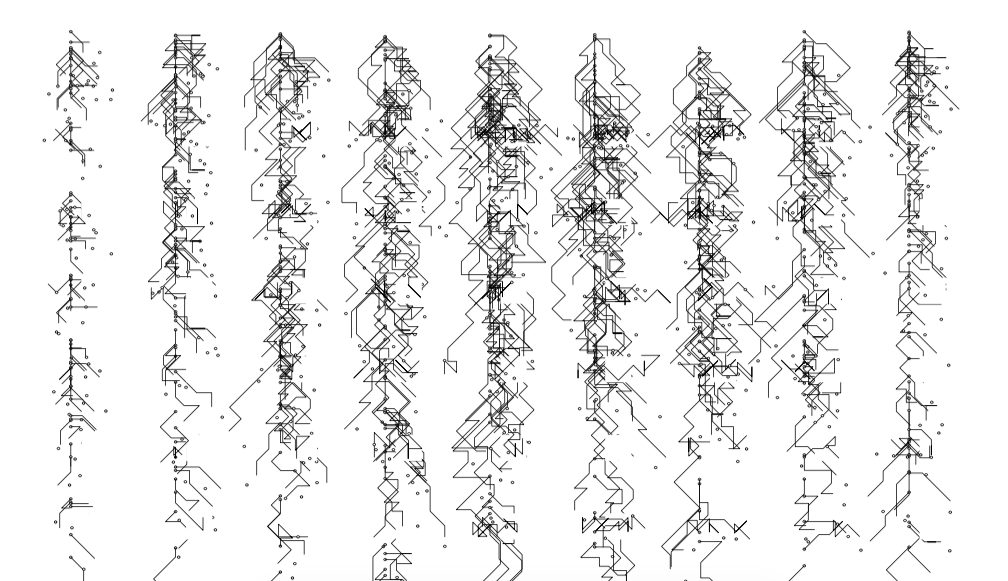
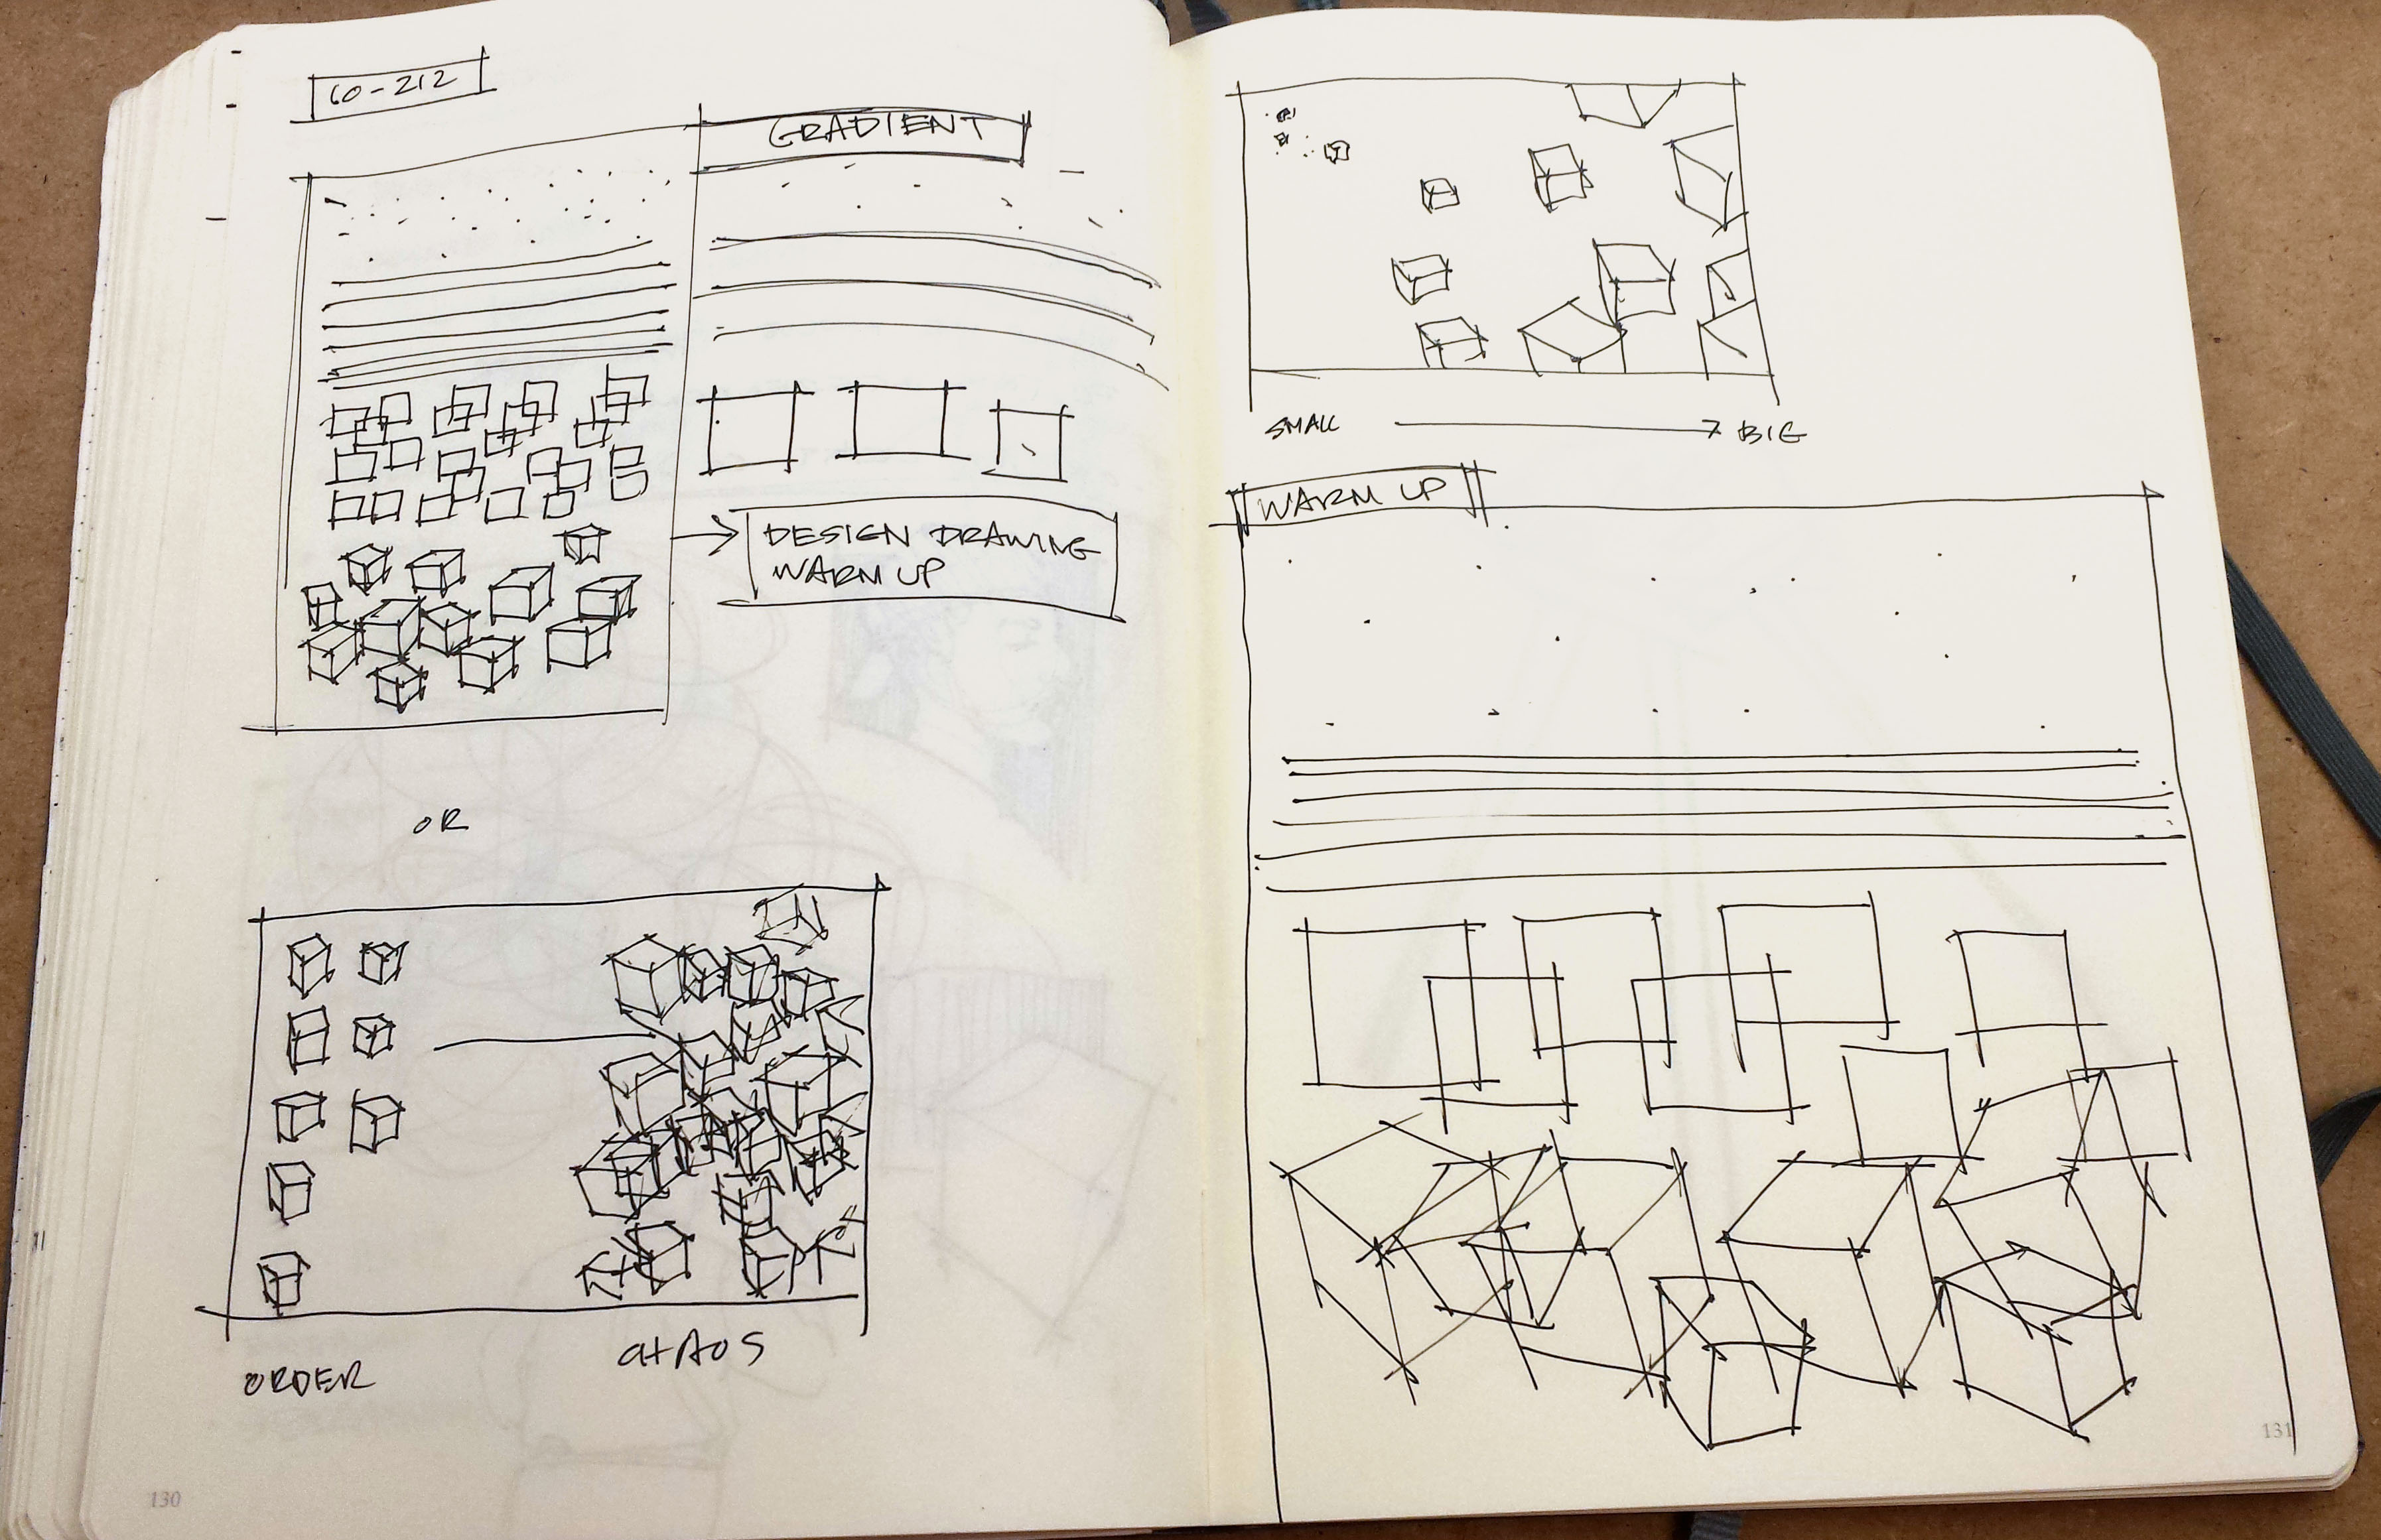
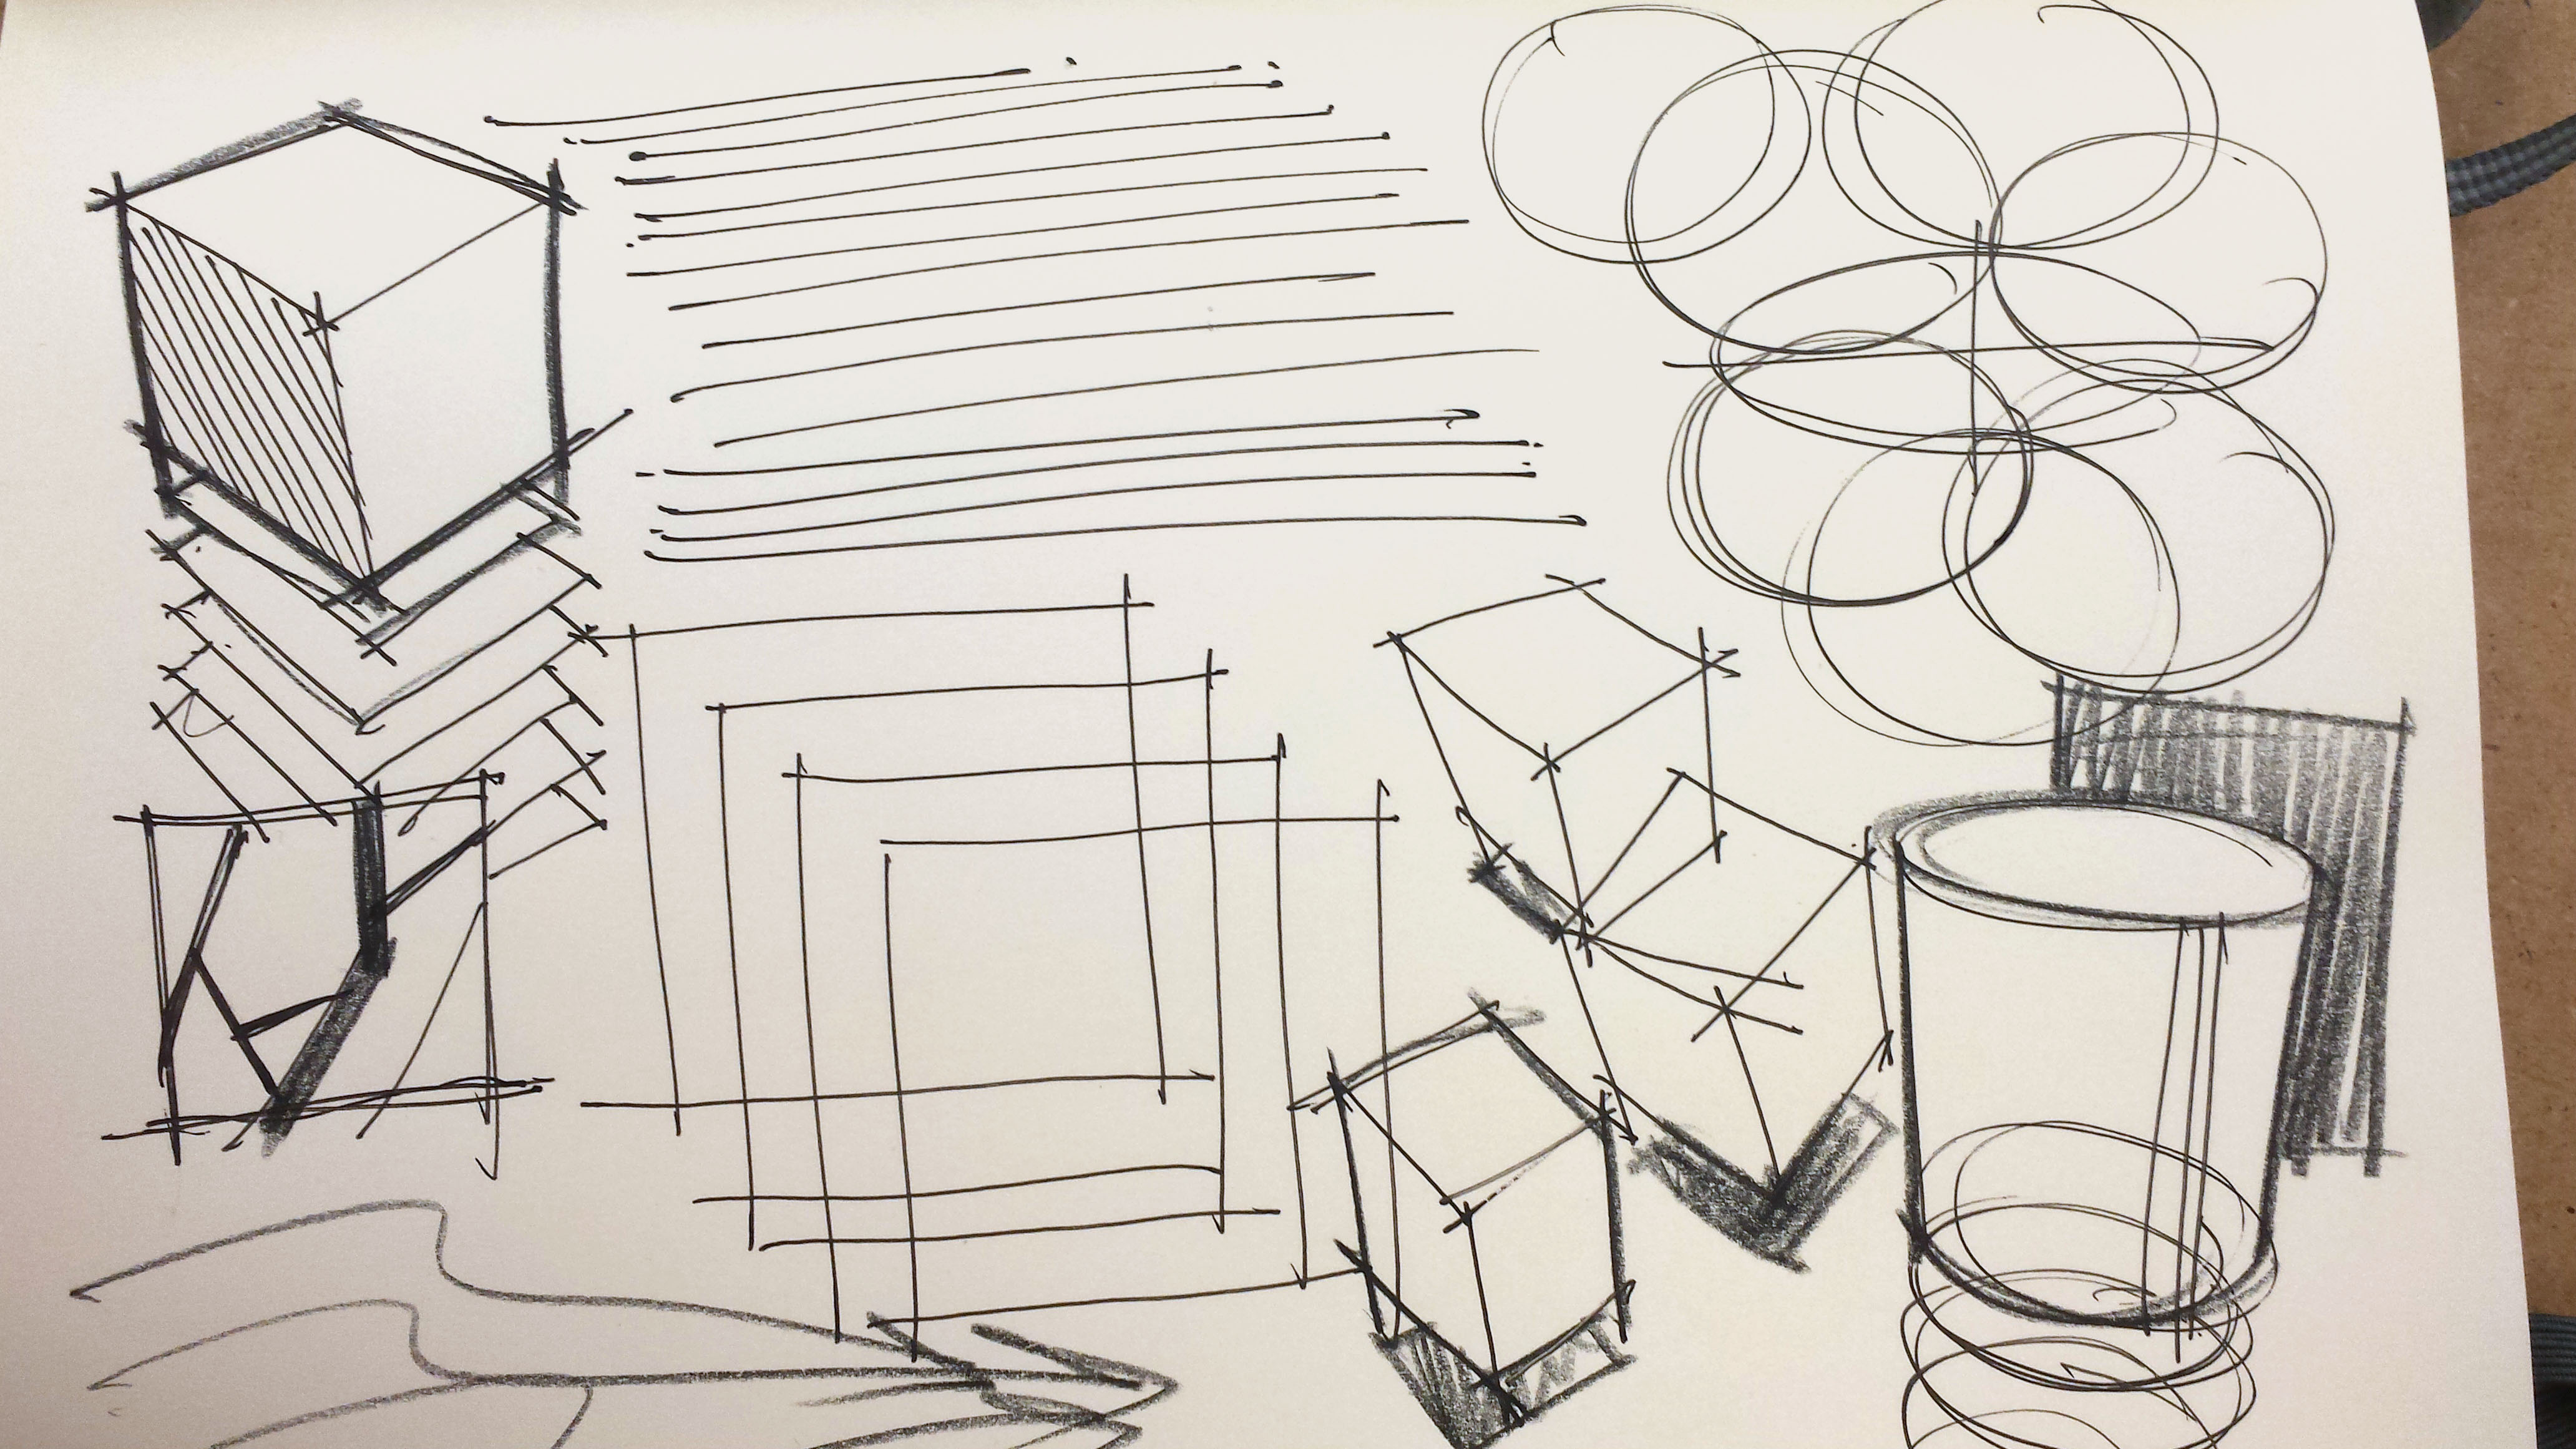
To be completely honest, this is a foreign way of working for me. I’m very used to asking the traditional question of “What should be designed?”, not the engineering question of “what is designable?” Playing with this question was an ongoing game of discovery during the project and one I’m learning to better understand. Furthermore, the way I setup my code using the provided template made my program consistently export PDFs throughout my working process, so I have a good amount of iteration history. [see above and below]
Technical Details
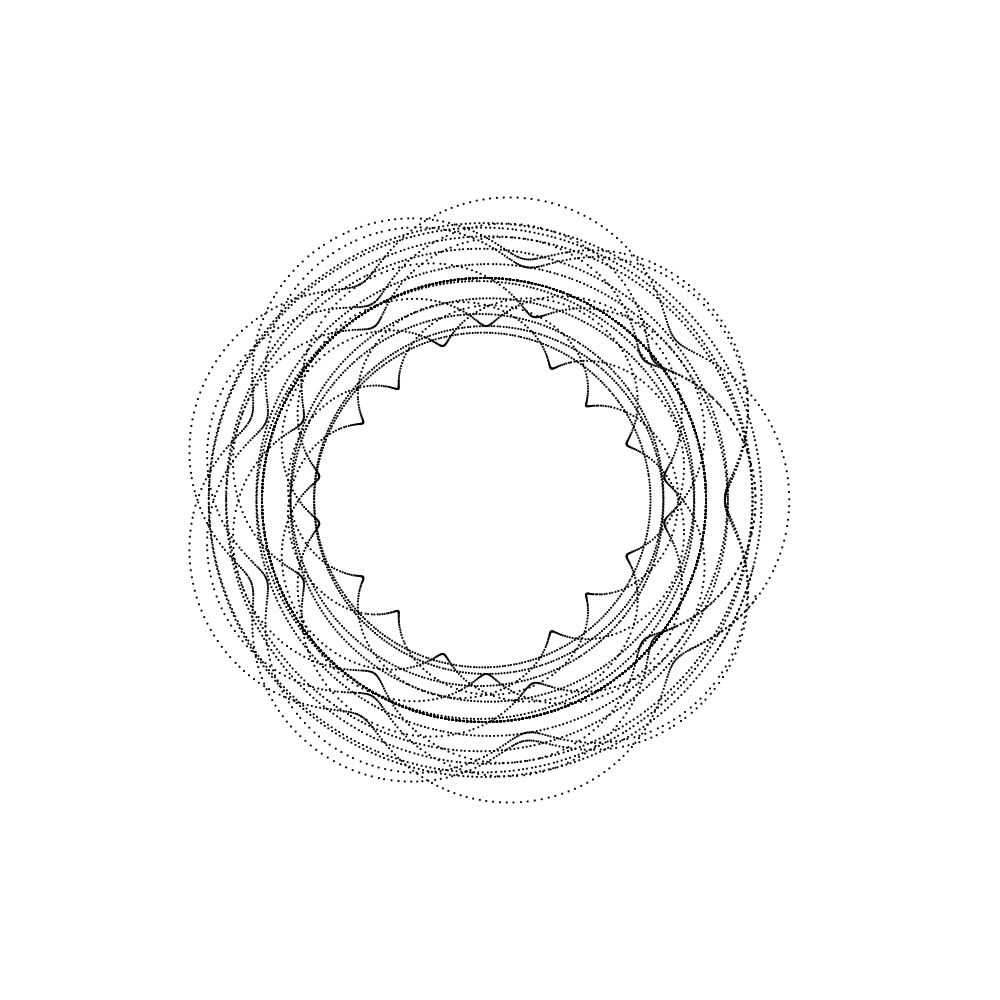
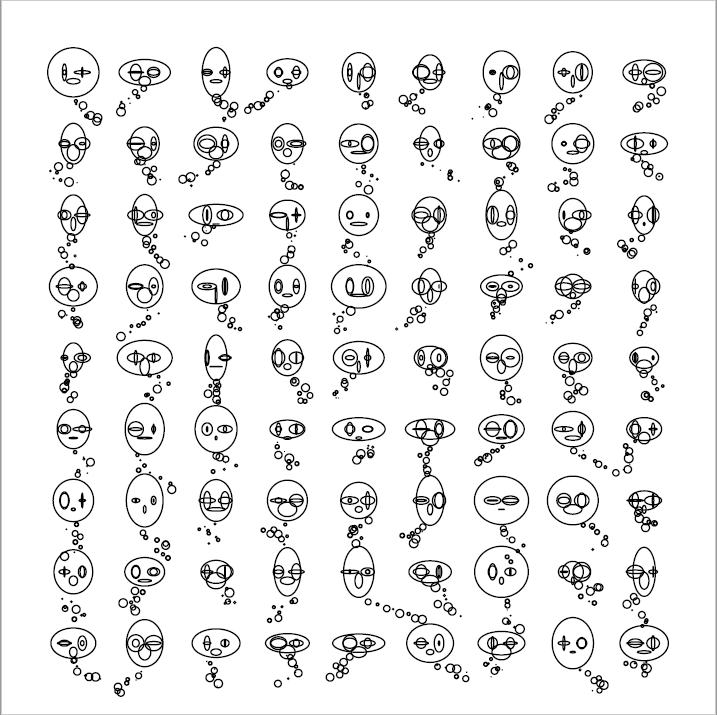
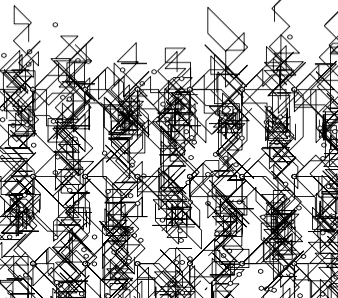
From an engineering point of view, this project involved more complexity than I’ve dealt with in the past. To start, I used a dynamic-grid-column drawing system to define the regions of my canvas. Then I use those predefined rectangular shapes to write numbers inside of them using the createFont() method, but importantly, instead of drawing the fonts to the canvas, I drew them to a JAVA2D PGraphics ‘offscreen’ canvas. I remixed some of the code for this from this github project. This means all of the numbers are being drawn in my custom font, GT Walsheim, directly onto an image object instead onto the primary canvas. The reason I do this is to allow for easy distortion and warping of the pixels and elements without having to convert text to outlines and deal with bezier curves.
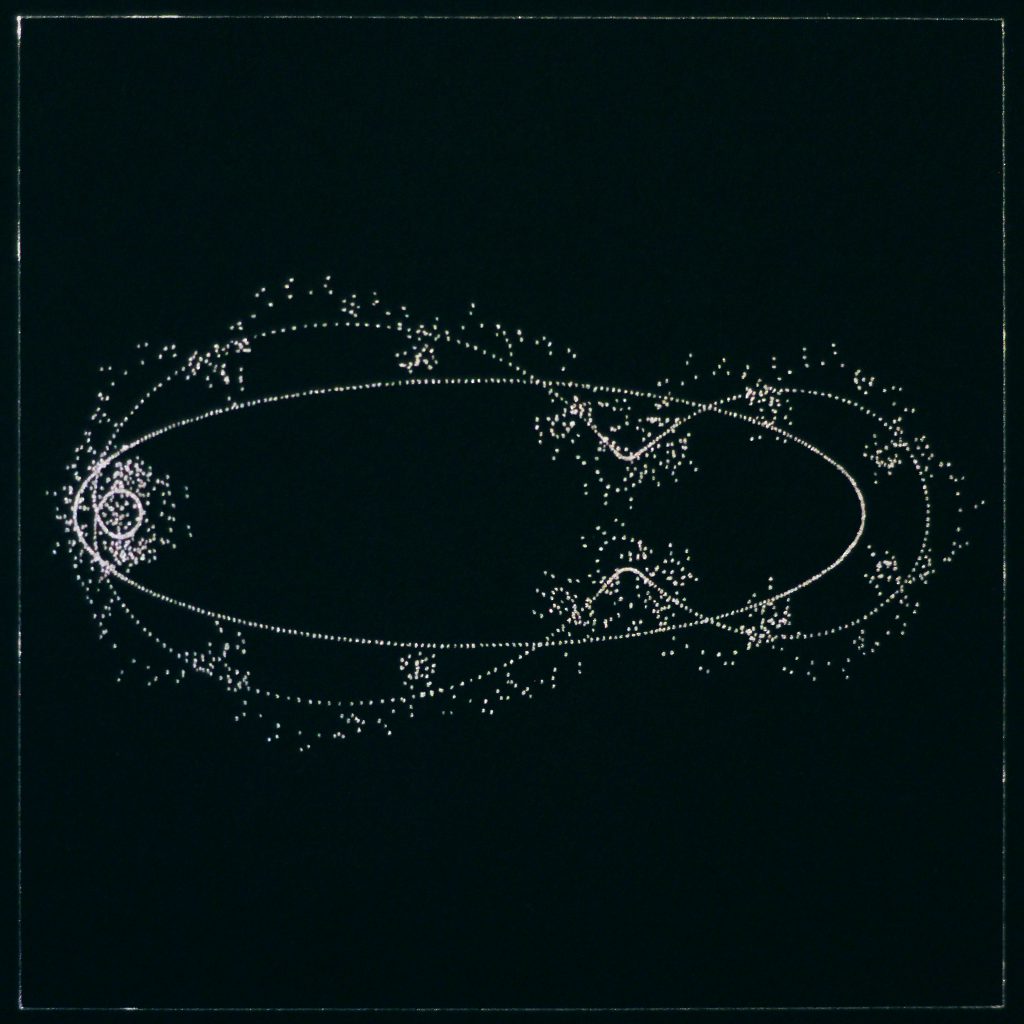
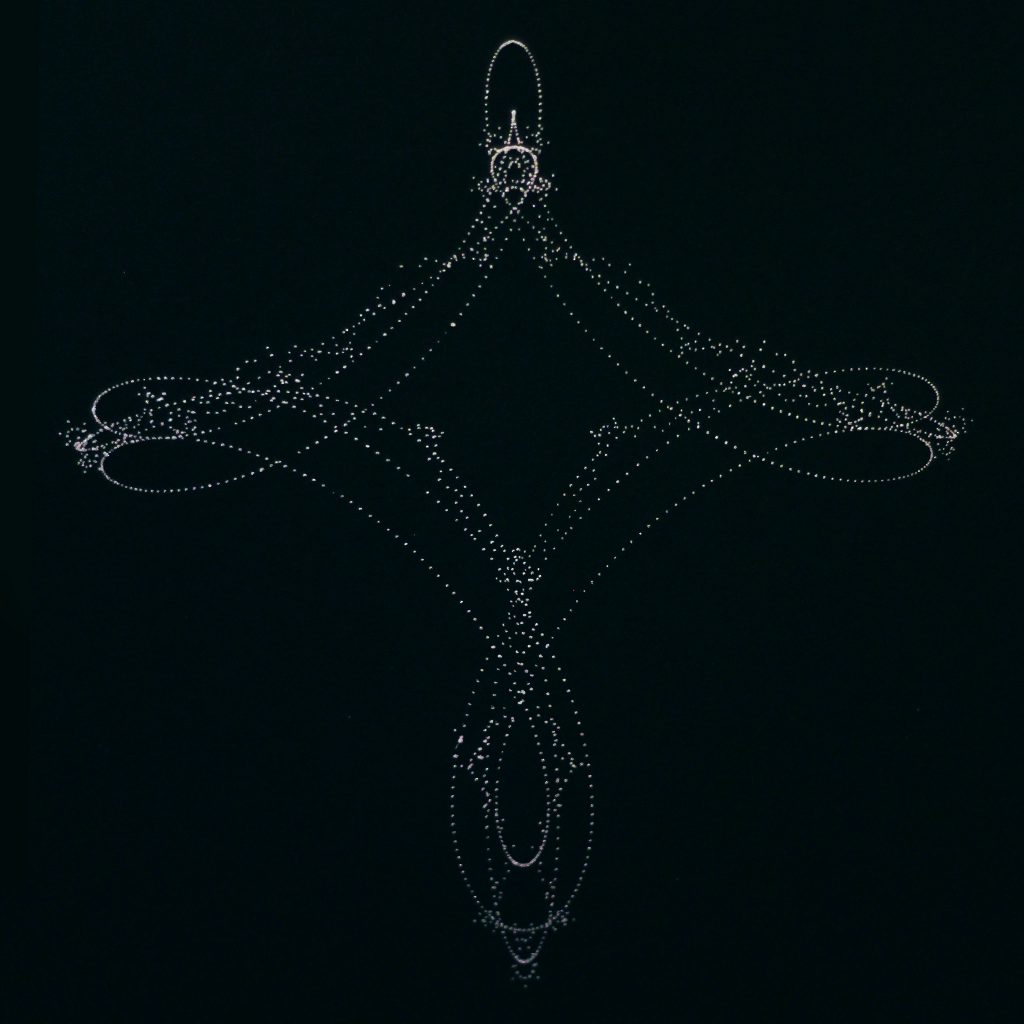
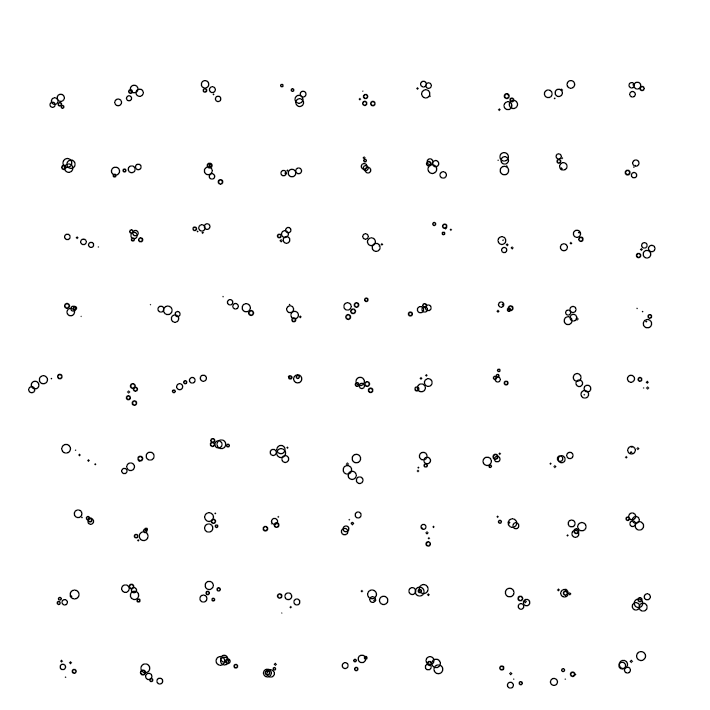
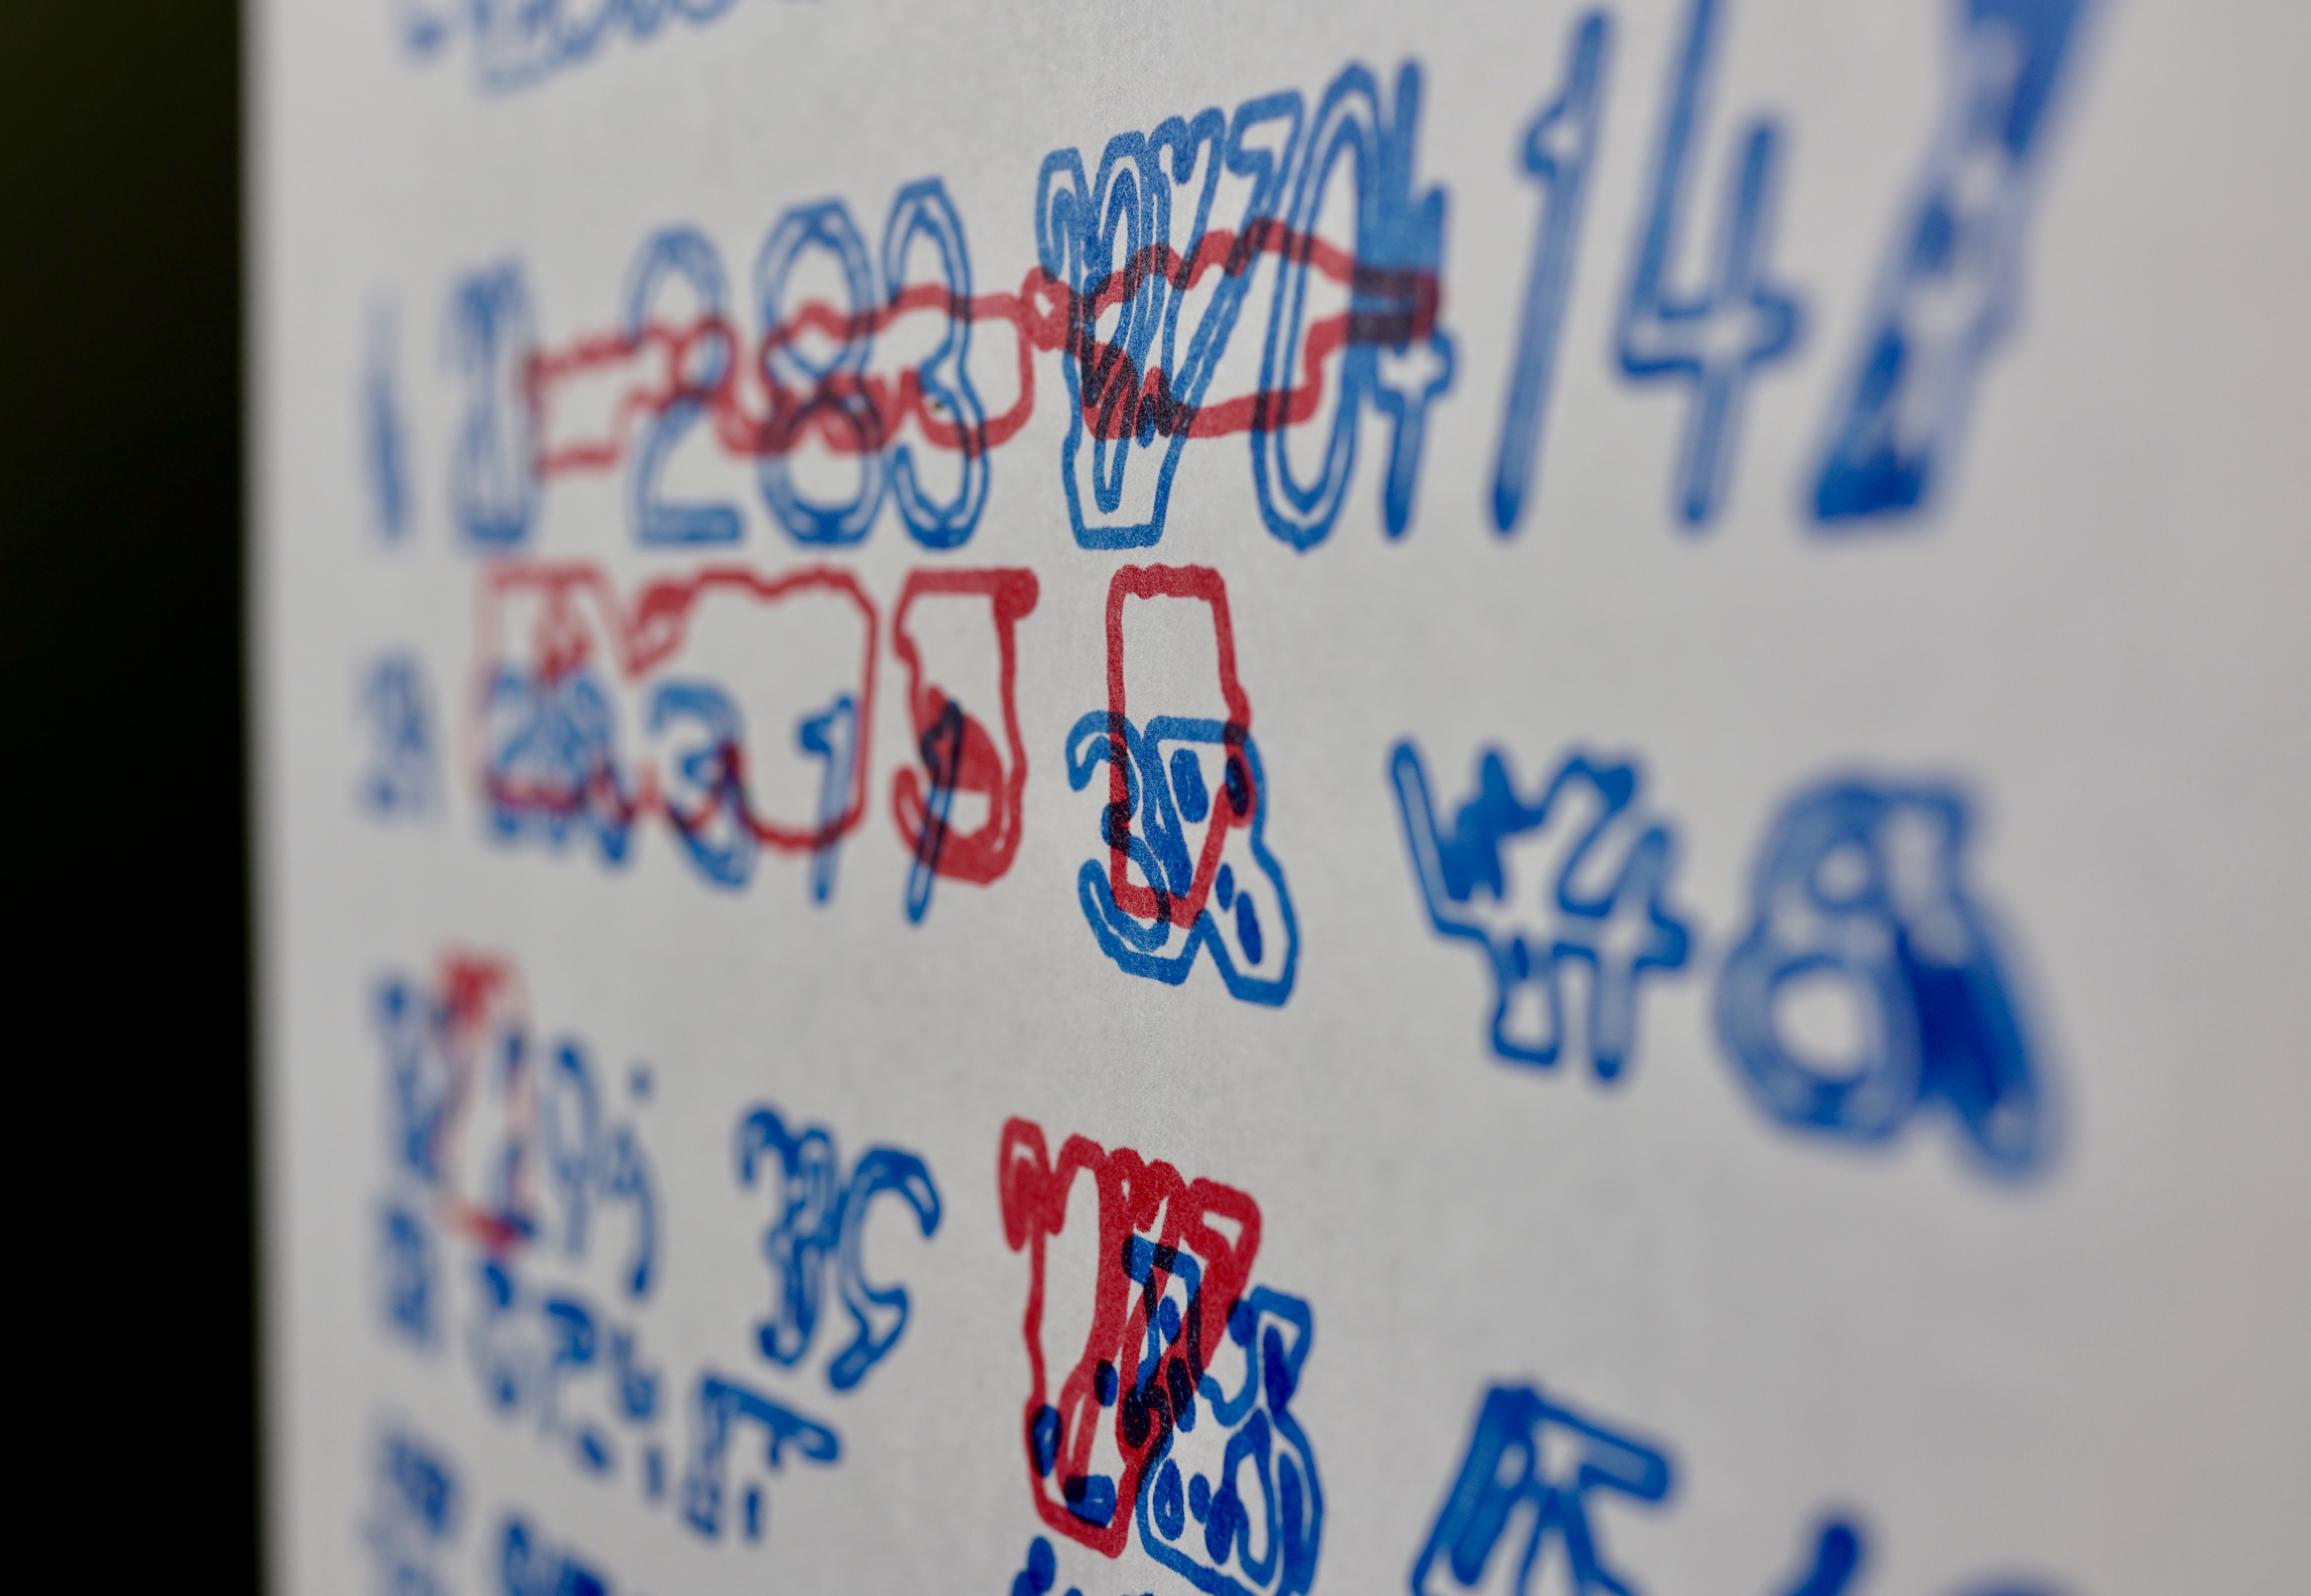
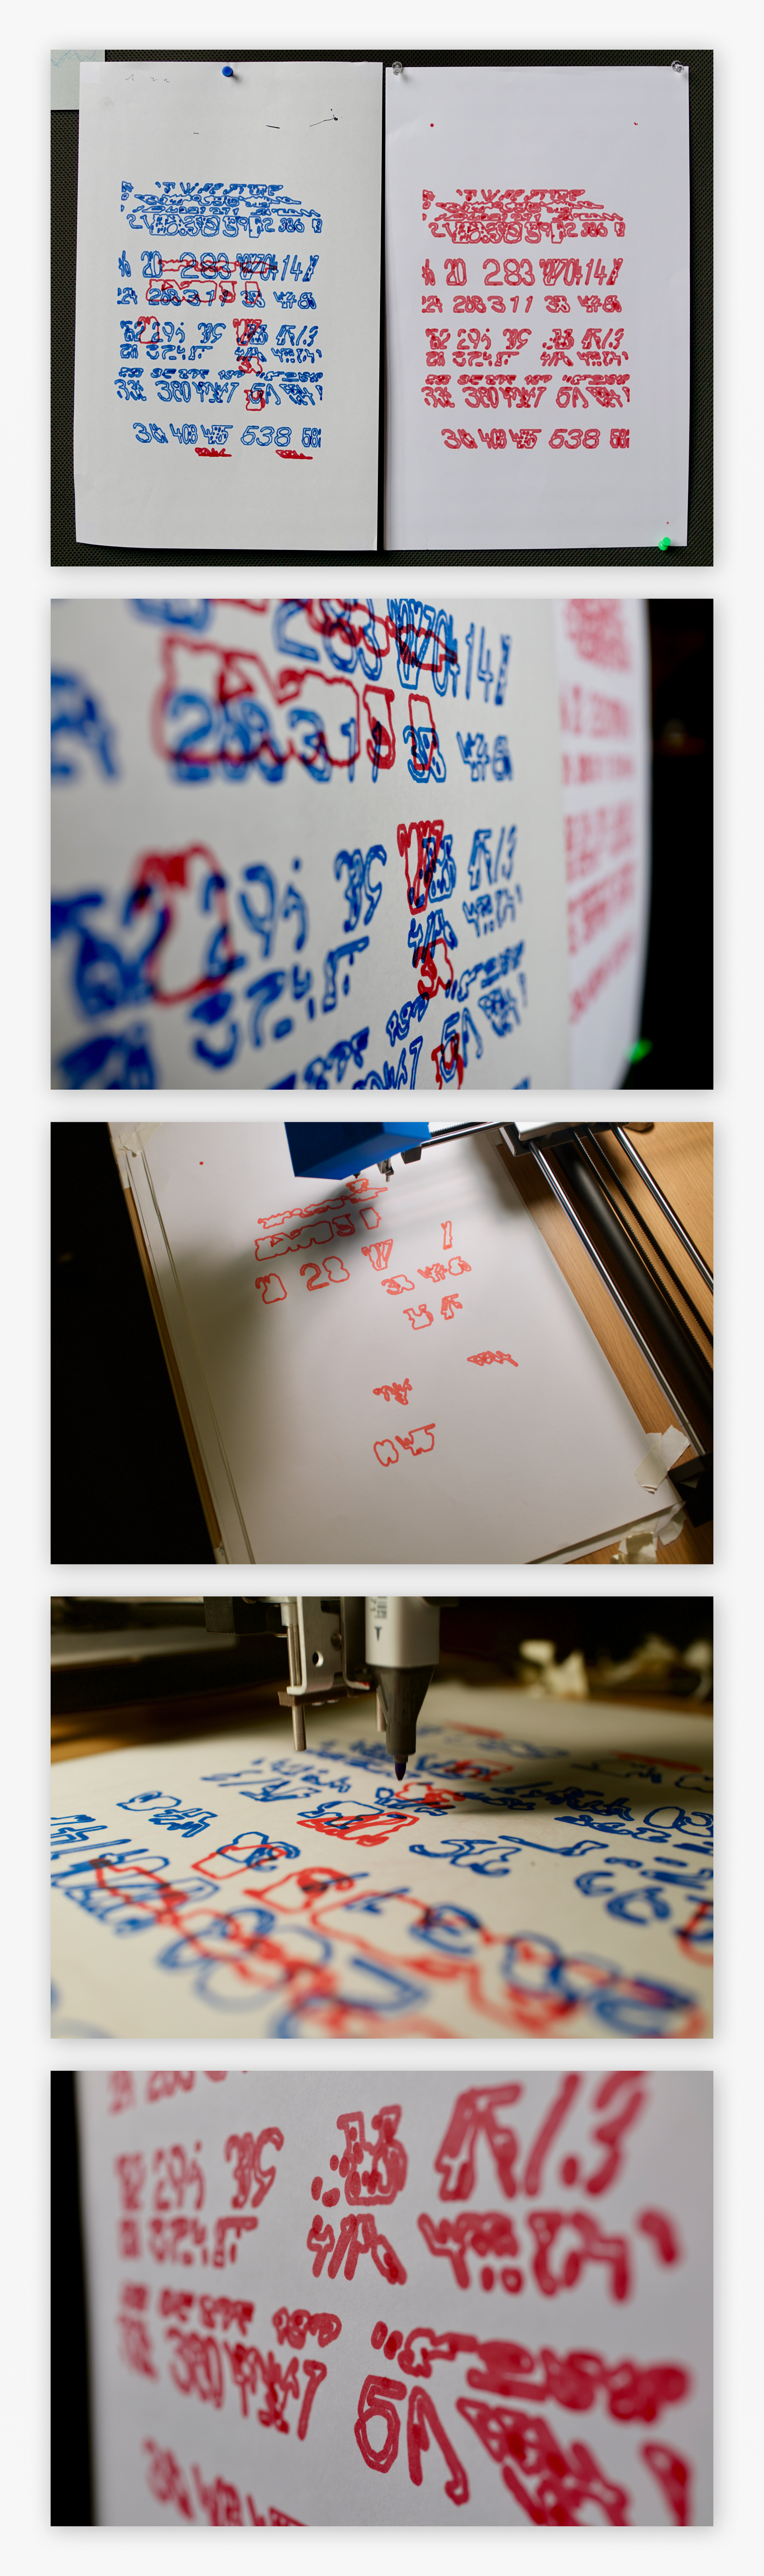
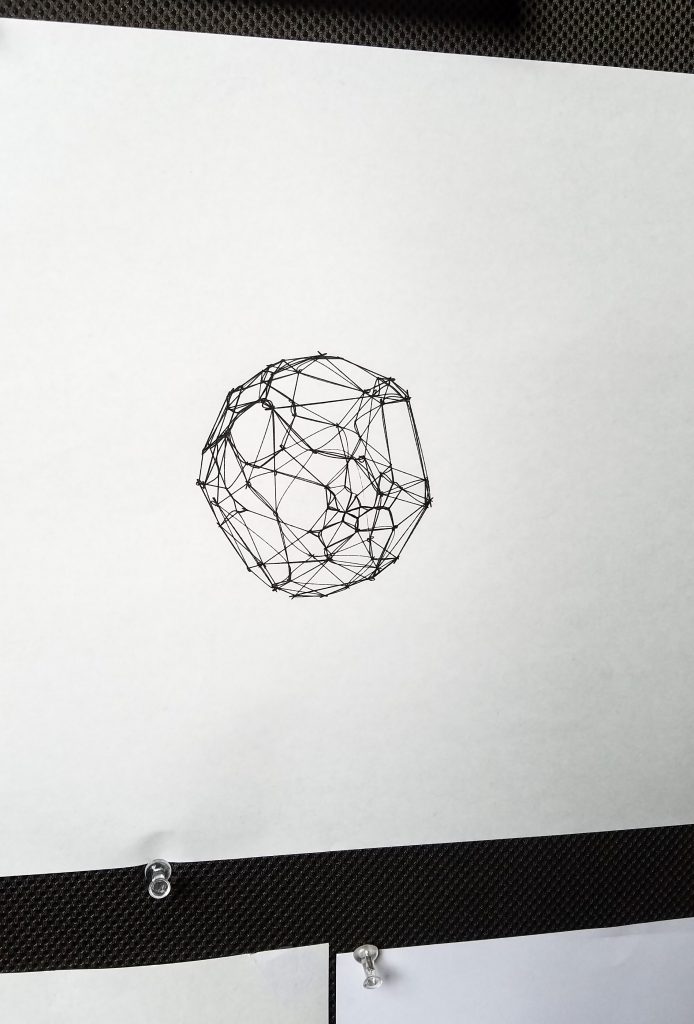
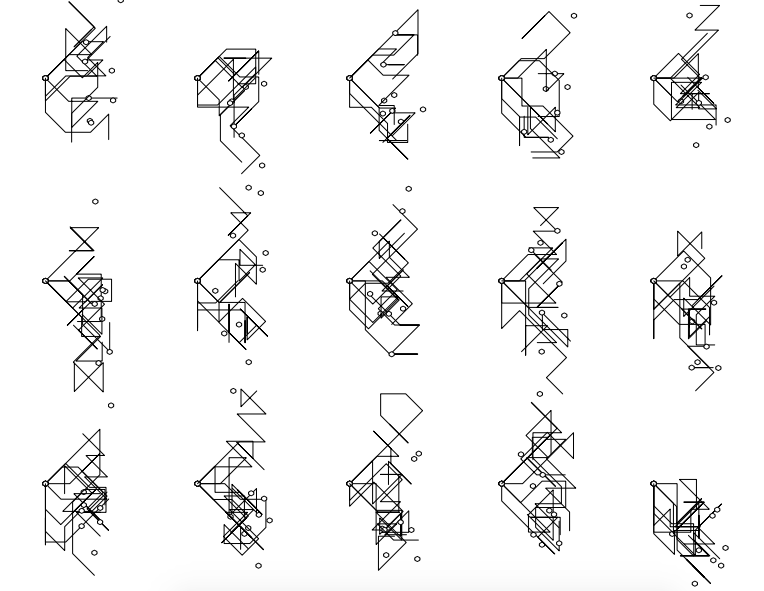
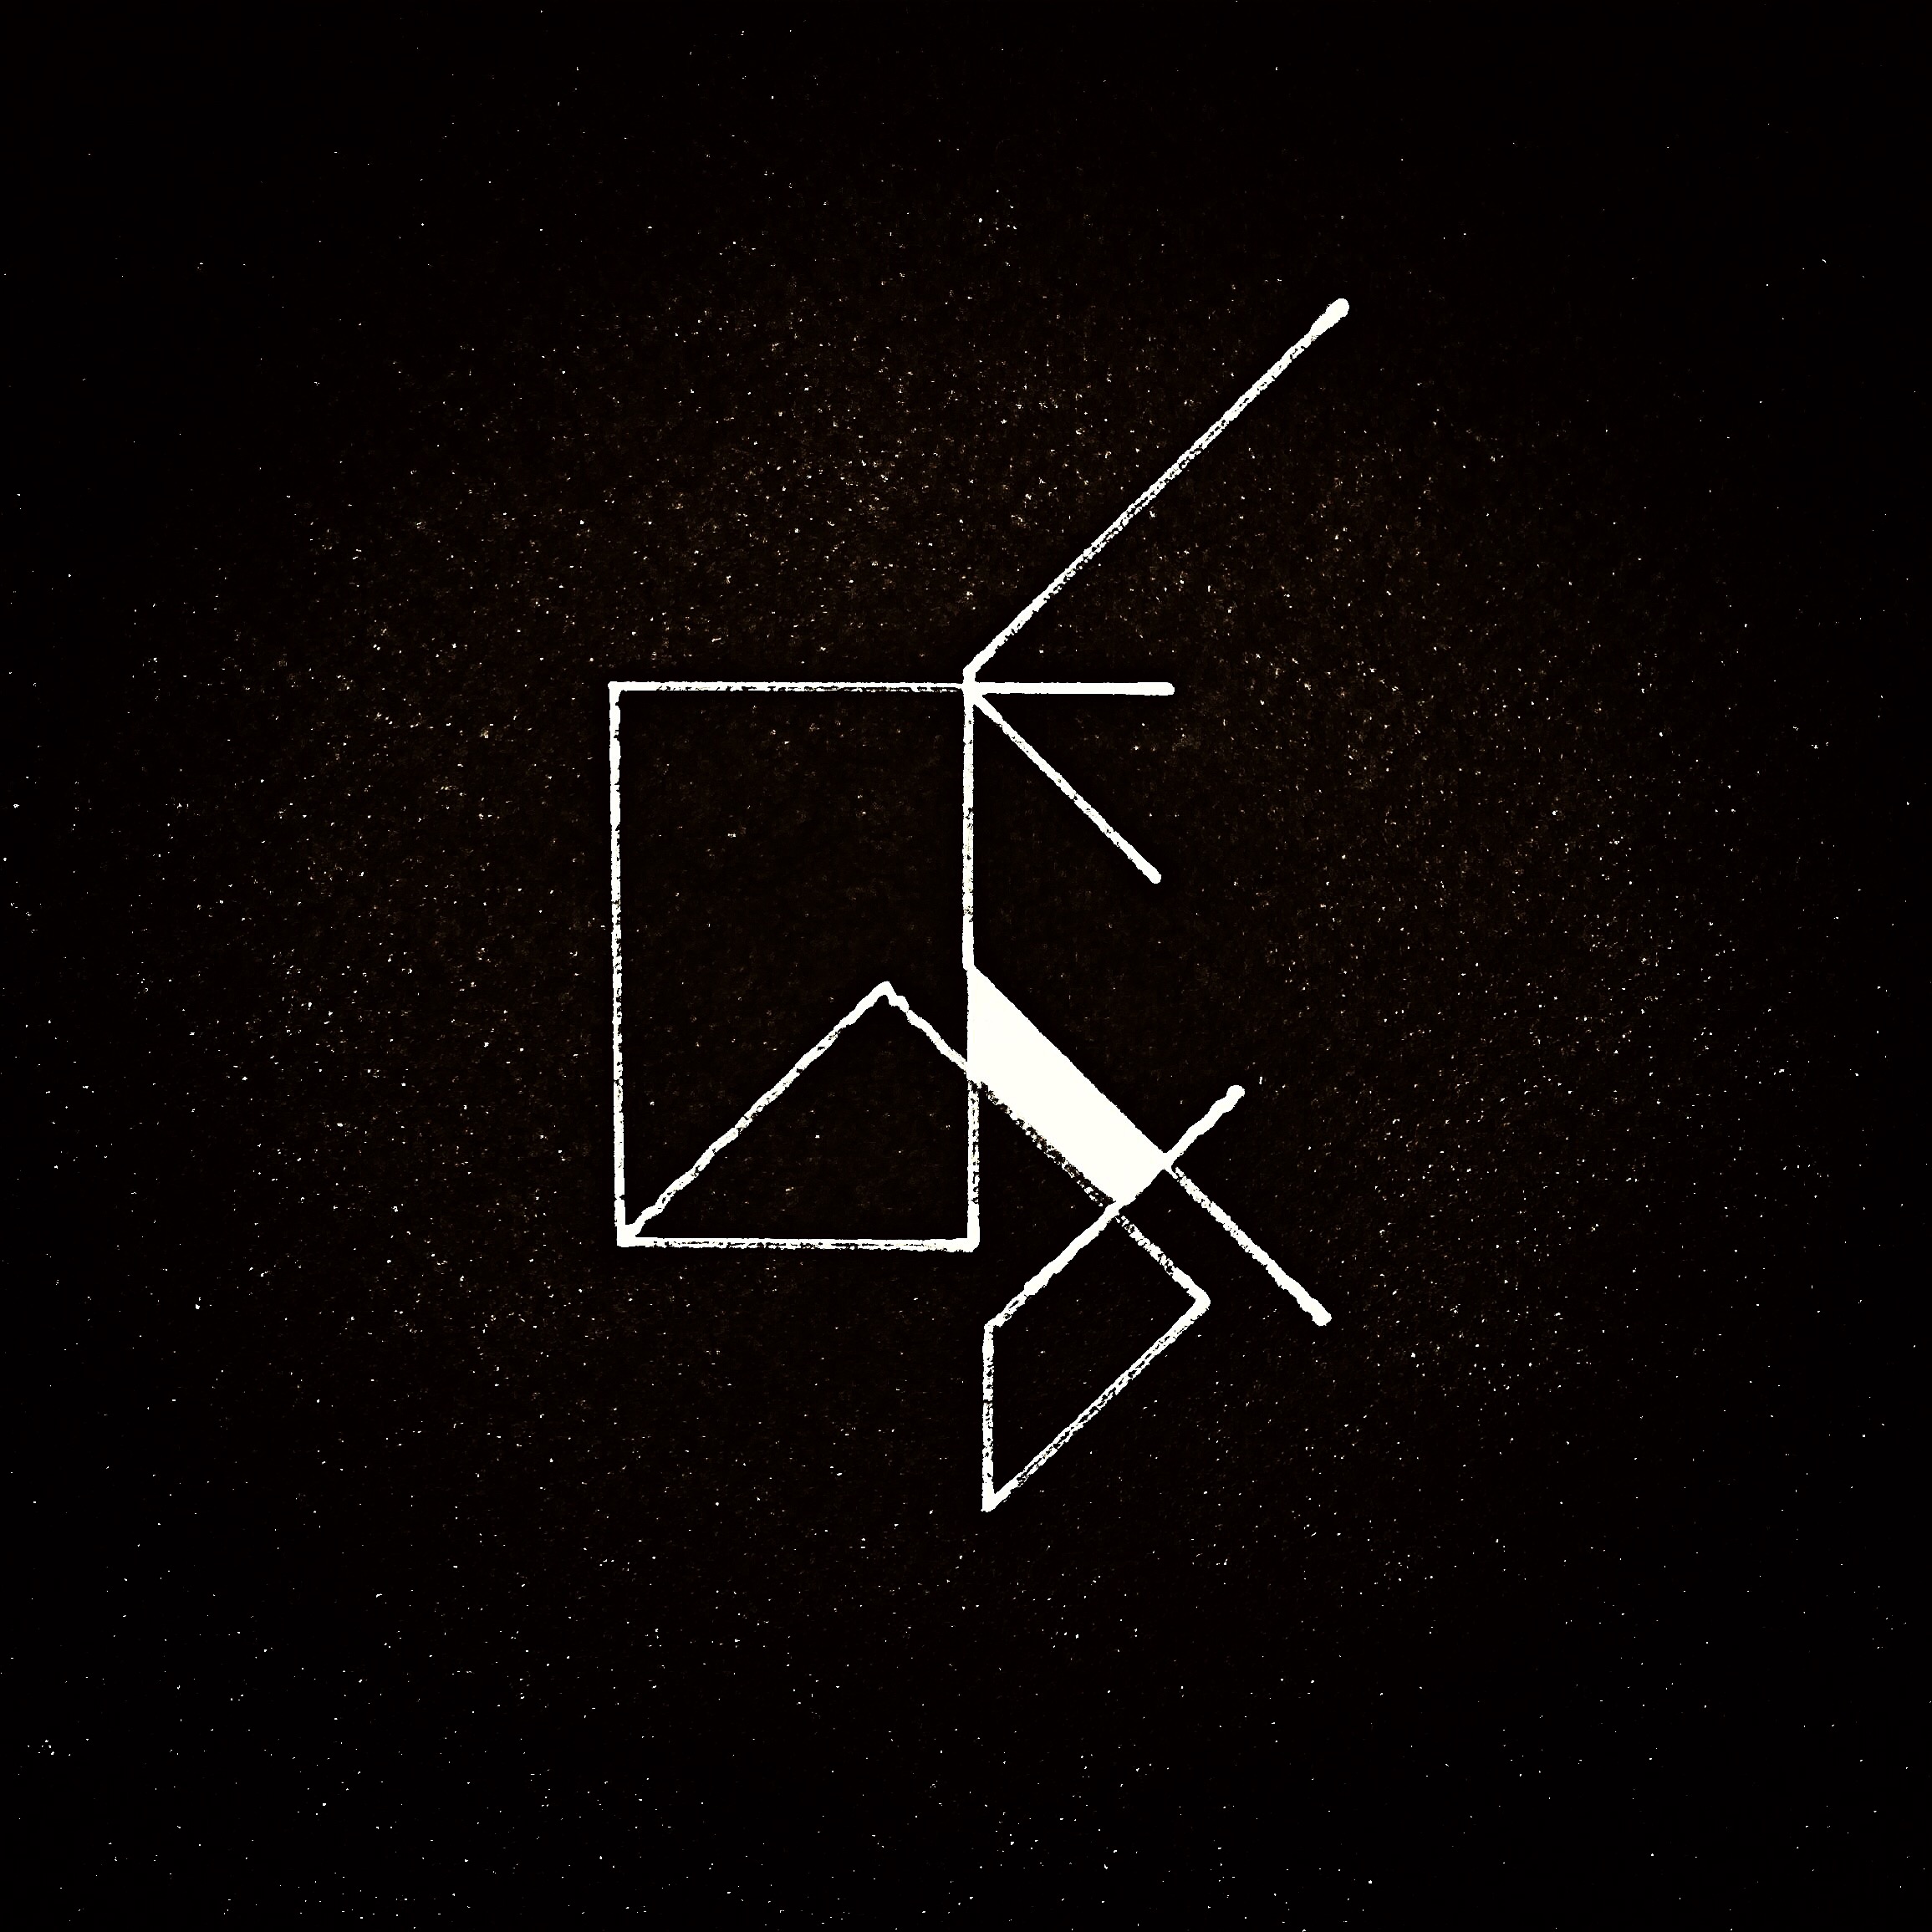
The followup question was how do I get my design back out of raster format into ‘vector/object’ format, so I can use an exported PDF with the AkiDraw device? I used a method for scanning the pixels of the raster with the get() method, then I’m able to ‘etch the drawing’ back out of pixels and place objects that will export in the PDF where the colour values register in certain ranges. [see the video below for an example]
Etching Method Test
Photo & Video Gallery
// see https://processing.org/reference/libraries/pdf/index.html //<>// //<>//
import processing.pdf.*;
boolean bRecordingPDF;
int pdfOutputCount = 0;
PFont myFont;
Gridmaker newGrid;
PGraphics pg;
int textSize = 40;
float magicYimpactor;
float amount;
float currentChaos;

void setup() {
  size(612, 792);
  bRecordingPDF = true;
  myFont = createFont("GT-Walsheim-Thin-Trial.otf", textSize);
  textFont(myFont);

  newGrid = new Gridmaker();
  pg = createGraphics(width, height, JAVA2D); // create a PGraphics the same size as the main sketch display window
}

void draw() {
  if (bRecordingPDF) {
    background(255); // this should come BEFORE beginRecord()

    //START -- -- -- CAMBU FUNCTIONS
    pg.beginDraw(); // start drawing to the PGraphics
    drawGrid();
    chaosRepresentation();

    pg.endDraw(); // finish drawing to the PGraphics
    //END -- -- -- CAMBU FUNCTIONS
    image(pg, 0, 0);
    // -- -- -- function that reads all of pg and places points/ellipses at certain values of a certain brightness
    beginRecord(PDF, "cambu_" + pdfOutputCount + ".pdf");
    rasterToNotVector();
    endRecord();
    bRecordingPDF = false;
    pdfOutputCount++;
  }
}

void keyPressed() {
  //rasterToNotVector();
  //magicYimpactor = mouseX*0.0005;
  magicYimpactor = mouseX*0.05;
  //magicXXX = mouseX;
  //magicXimpactor = mouseY*0.0005;
  //amount = mouseX*0.0005;
  bRecordingPDF = true;
}

void chaosRepresentation() {
  float chaosStart = 1;
  int startX = 0;
  int startY = 0;

  int chaosIndex = 0;
  for (int y = 0; y < newGrid.numberOfRows; y++) { //verticalDivisor, x amount
    startX = 0;
    for (int x = 0; x < newGrid.numberOfCols; x++) { // horizontalDivisor, y amount
      fill((255/newGrid.numberOfCols)*(y/2), (255/newGrid.numberOfRows)*x, 200);
      //rect(startX,startY,newGrid.horizontalDivisor,newGrid.verticalDivisor); //within the domain & range of this rectangle, transform the pixels on pg
      chaosIndex = chaosIndex + 1;
      currentChaos = chaosStart * chaosIndex;
      charsHere(startX, startY, currentChaos);
      startX = startX + newGrid.horizontalDivisor;
    }
    startY = startY + newGrid.verticalDivisor;
  }
}

void charsHere(int x, int y, float currentChaos) {
  int a = round((x + y)*.5);

  pg.textFont(myFont);
  pg.textSize(textSize);
  pg.fill(0, 0, 0);

  int xDes = x+(newGrid.horizontalDivisor/16);
  int yDes = y-(newGrid.verticalDivisor/4);

  pg.text(a, xDes, yDes);
  quadrantDestoryer(xDes, yDes, currentChaos); // operates between (startX, startY, newGrid.horizontalDivisor, newGrid.verticalDivisor)
}

void quadrantDestoryer(int xToDes, int yToDes, float currentChaos) {
  float xA = xToDes + 0.6*newGrid.horizontalDivisor - noise(currentChaos, yToDes, xToDes);
  float yA = yToDes - 0.2*newGrid.verticalDivisor;

  pg.fill(255, 235, 250);
  //pg.noStroke();
  //pg.ellipse(xToDes + 0.5*newGrid.horizontalDivisor * noise(currentChaos, yToDes), yToDes - 0.2*newGrid.verticalDivisor, noise(currentChaos, yToDes)*0.5*currentChaos, 0.05*currentChaos);
  //pg.ellipse(xA, yA, random(0, newGrid.horizontalDivisor)*0.8, noise(50, newGrid.horizontalDivisor)*2);
  //pg.rect(xA-8, yA, xA+ 30, yA + newGrid.verticalDivisor * 0.5);
  //pg.ellipse(xToDes, yToDes, currentChaos*noise(xToDes, yToDes), noise(currentChaos+currentChaos));
}

void rasterToNotVector() {//y down
  for (int y = 0; y < height; y ++) {
    for (int x = 0; x < width; x++) { //x across
      color cp = get(x, y);
      int b = (int)blue(cp);
      int g = (int)green(cp);
      int r = (int)red(cp);
      int tolerance = 150;

      float noised = 30;

      if (r < tolerance && g < tolerance && b < tolerance) {

        float amount = 30;

        float nx = noise(x/noised, y/noised);
        float ny = noise(magicYimpactor + x/noised, magicYimpactor + y/noised);

        nx = map(nx, 0, 1, -amount, amount); //cc to Golan for explaining distortion fields.

        ny = map(ny, 0, 1, -amount, amount*magicYimpactor);

        //line(x, y, x+nx, y+ny);
        strokeWeight(2);
        fill(34, 78, 240);
        ellipse(x + nx*0.5, y + ny/2, 4, 3);
      }
    }
  }
}
void drawGrid() {
  noStroke();
  int i = 0;
  for (int y = 0; y < newGrid.totalHeight; y = y + newGrid.verticalDivisor) { //squares down
    if (i % 2 == 0) {
      fill(140, 140, 140, 80);
    } else {
      fill(240, 240, 240, 80);
    } //if even, else odd
    i++;
  }

  int j = 0;
  for (int x = 0; x < newGrid.totalWidth; x = x + newGrid.horizontalDivisor) { ////squares across
    if (j % 2 == 0) {
      fill(140, 140, 140, 80);
    } else {
      fill(240, 240, 240, 80);
    } //if even, else odd
    j++;
  }
}

class Gridmaker {
  int totalHeight = height;
  int totalWidth = width;
  int numberOfRows = 12;
  int numberOfCols = 54;
  int verticalDivisor = round(totalHeight/numberOfRows);
  int horizontalDivisor = totalWidth/numberOfCols;
}
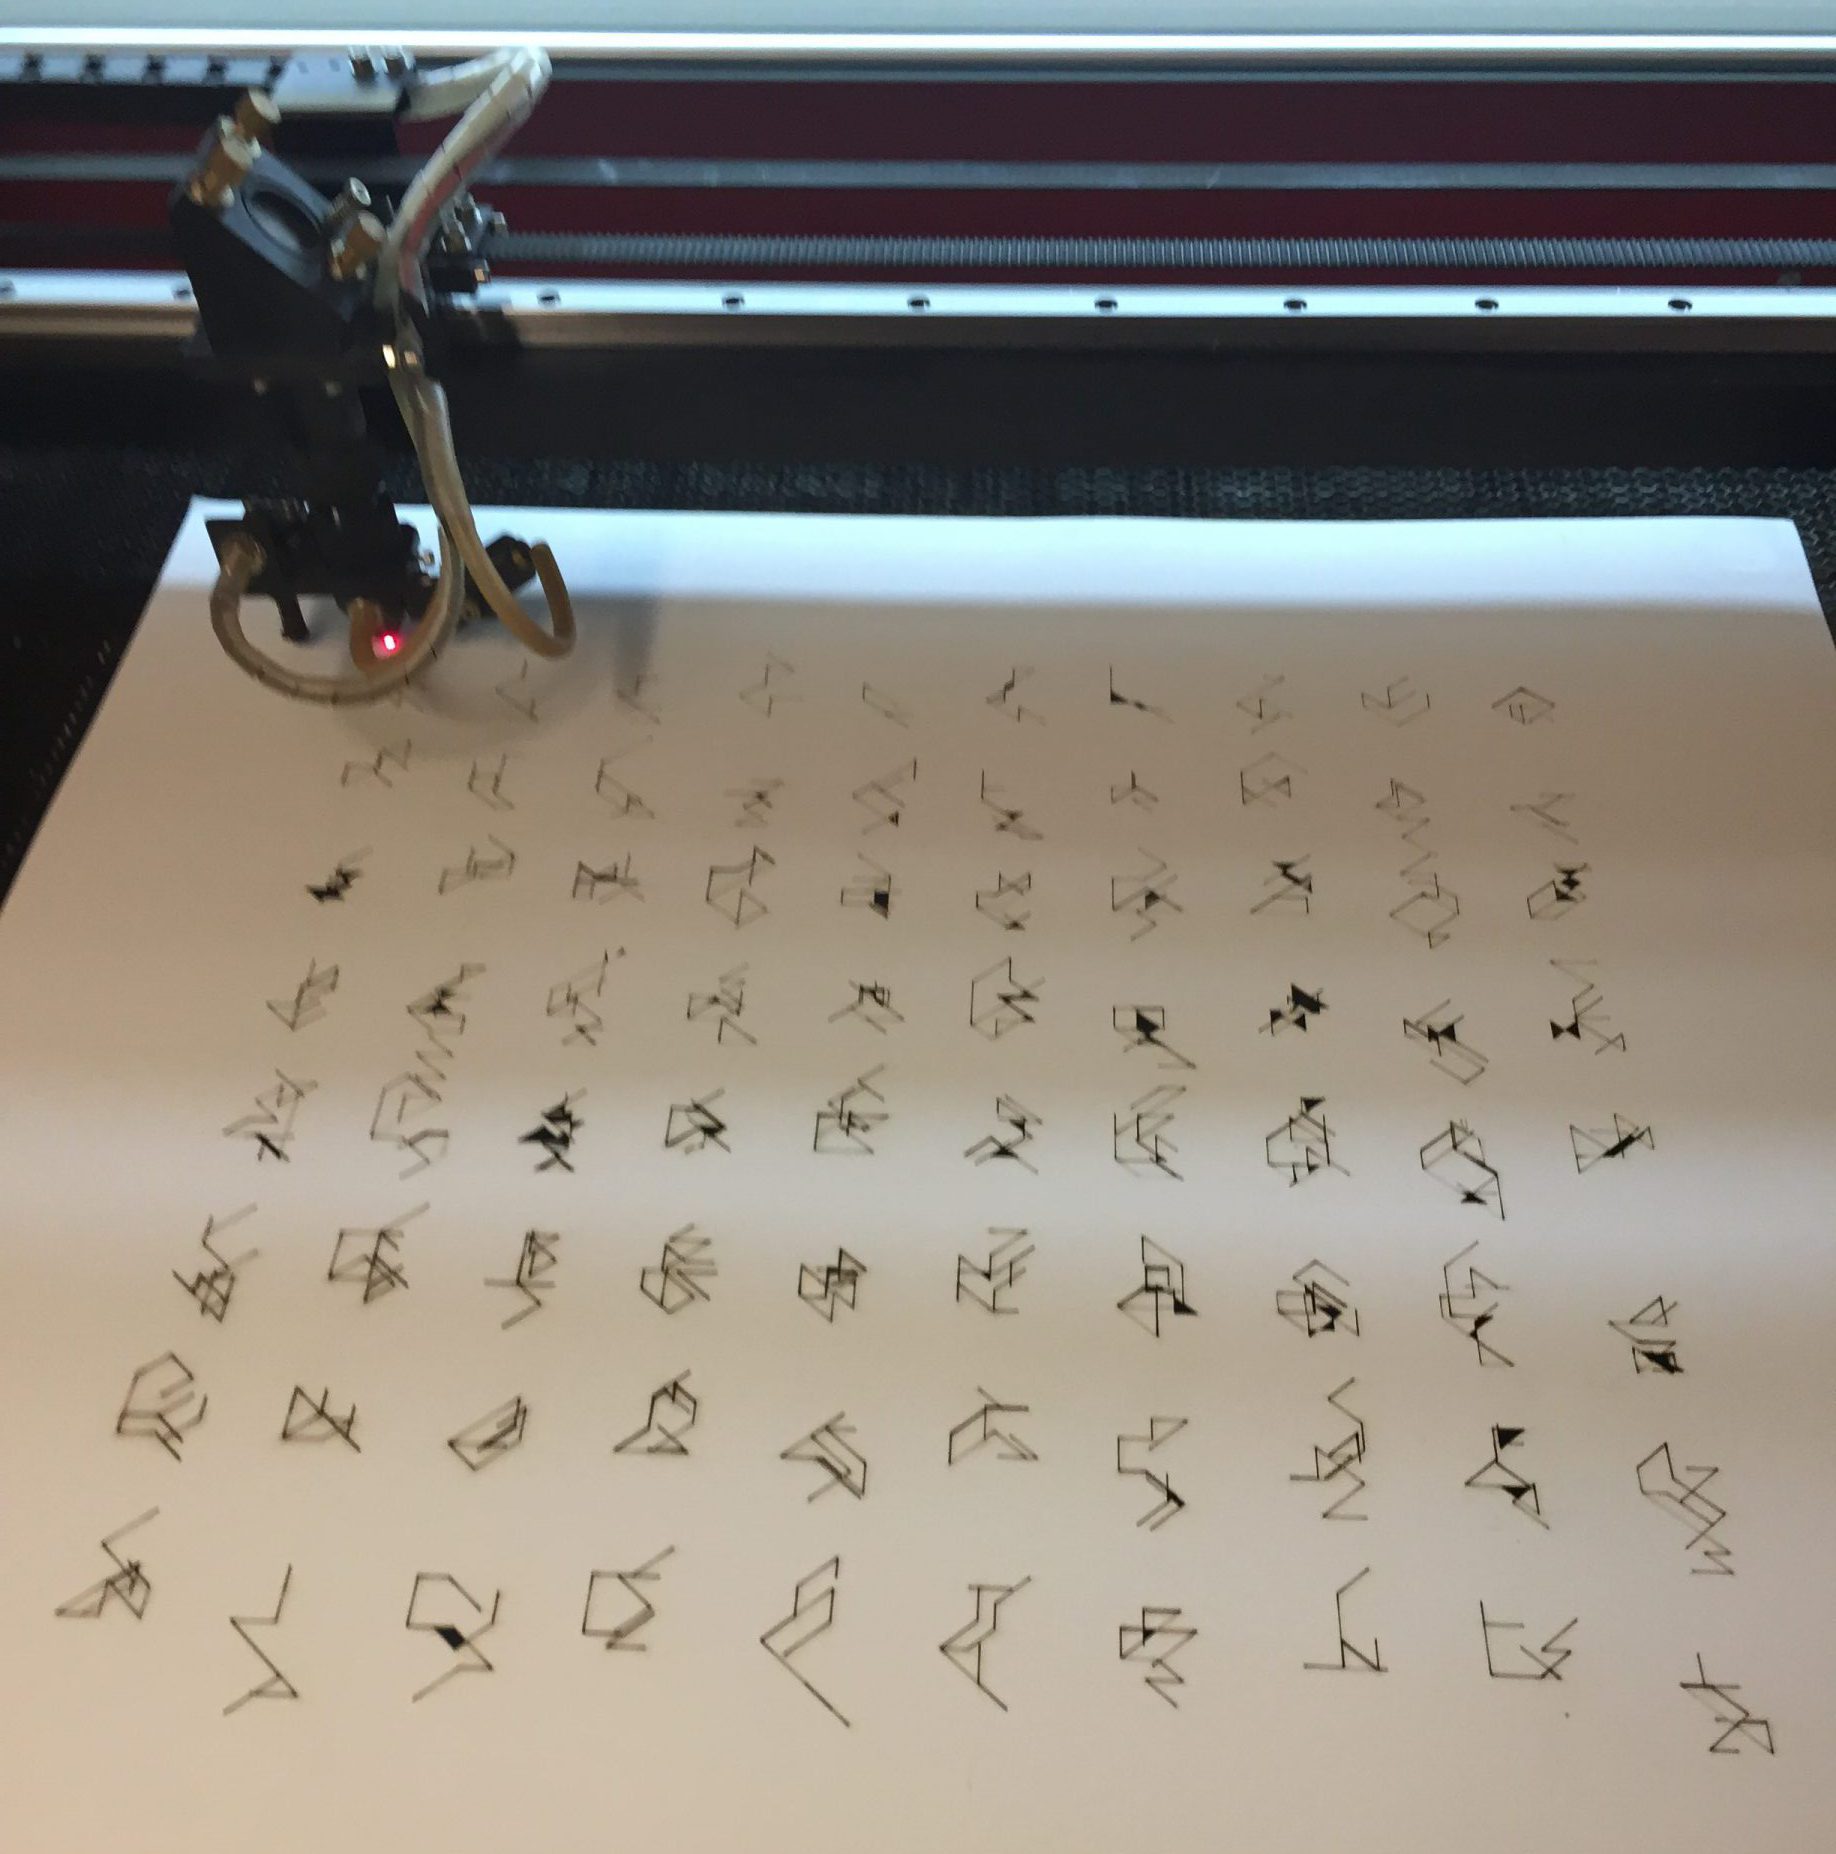
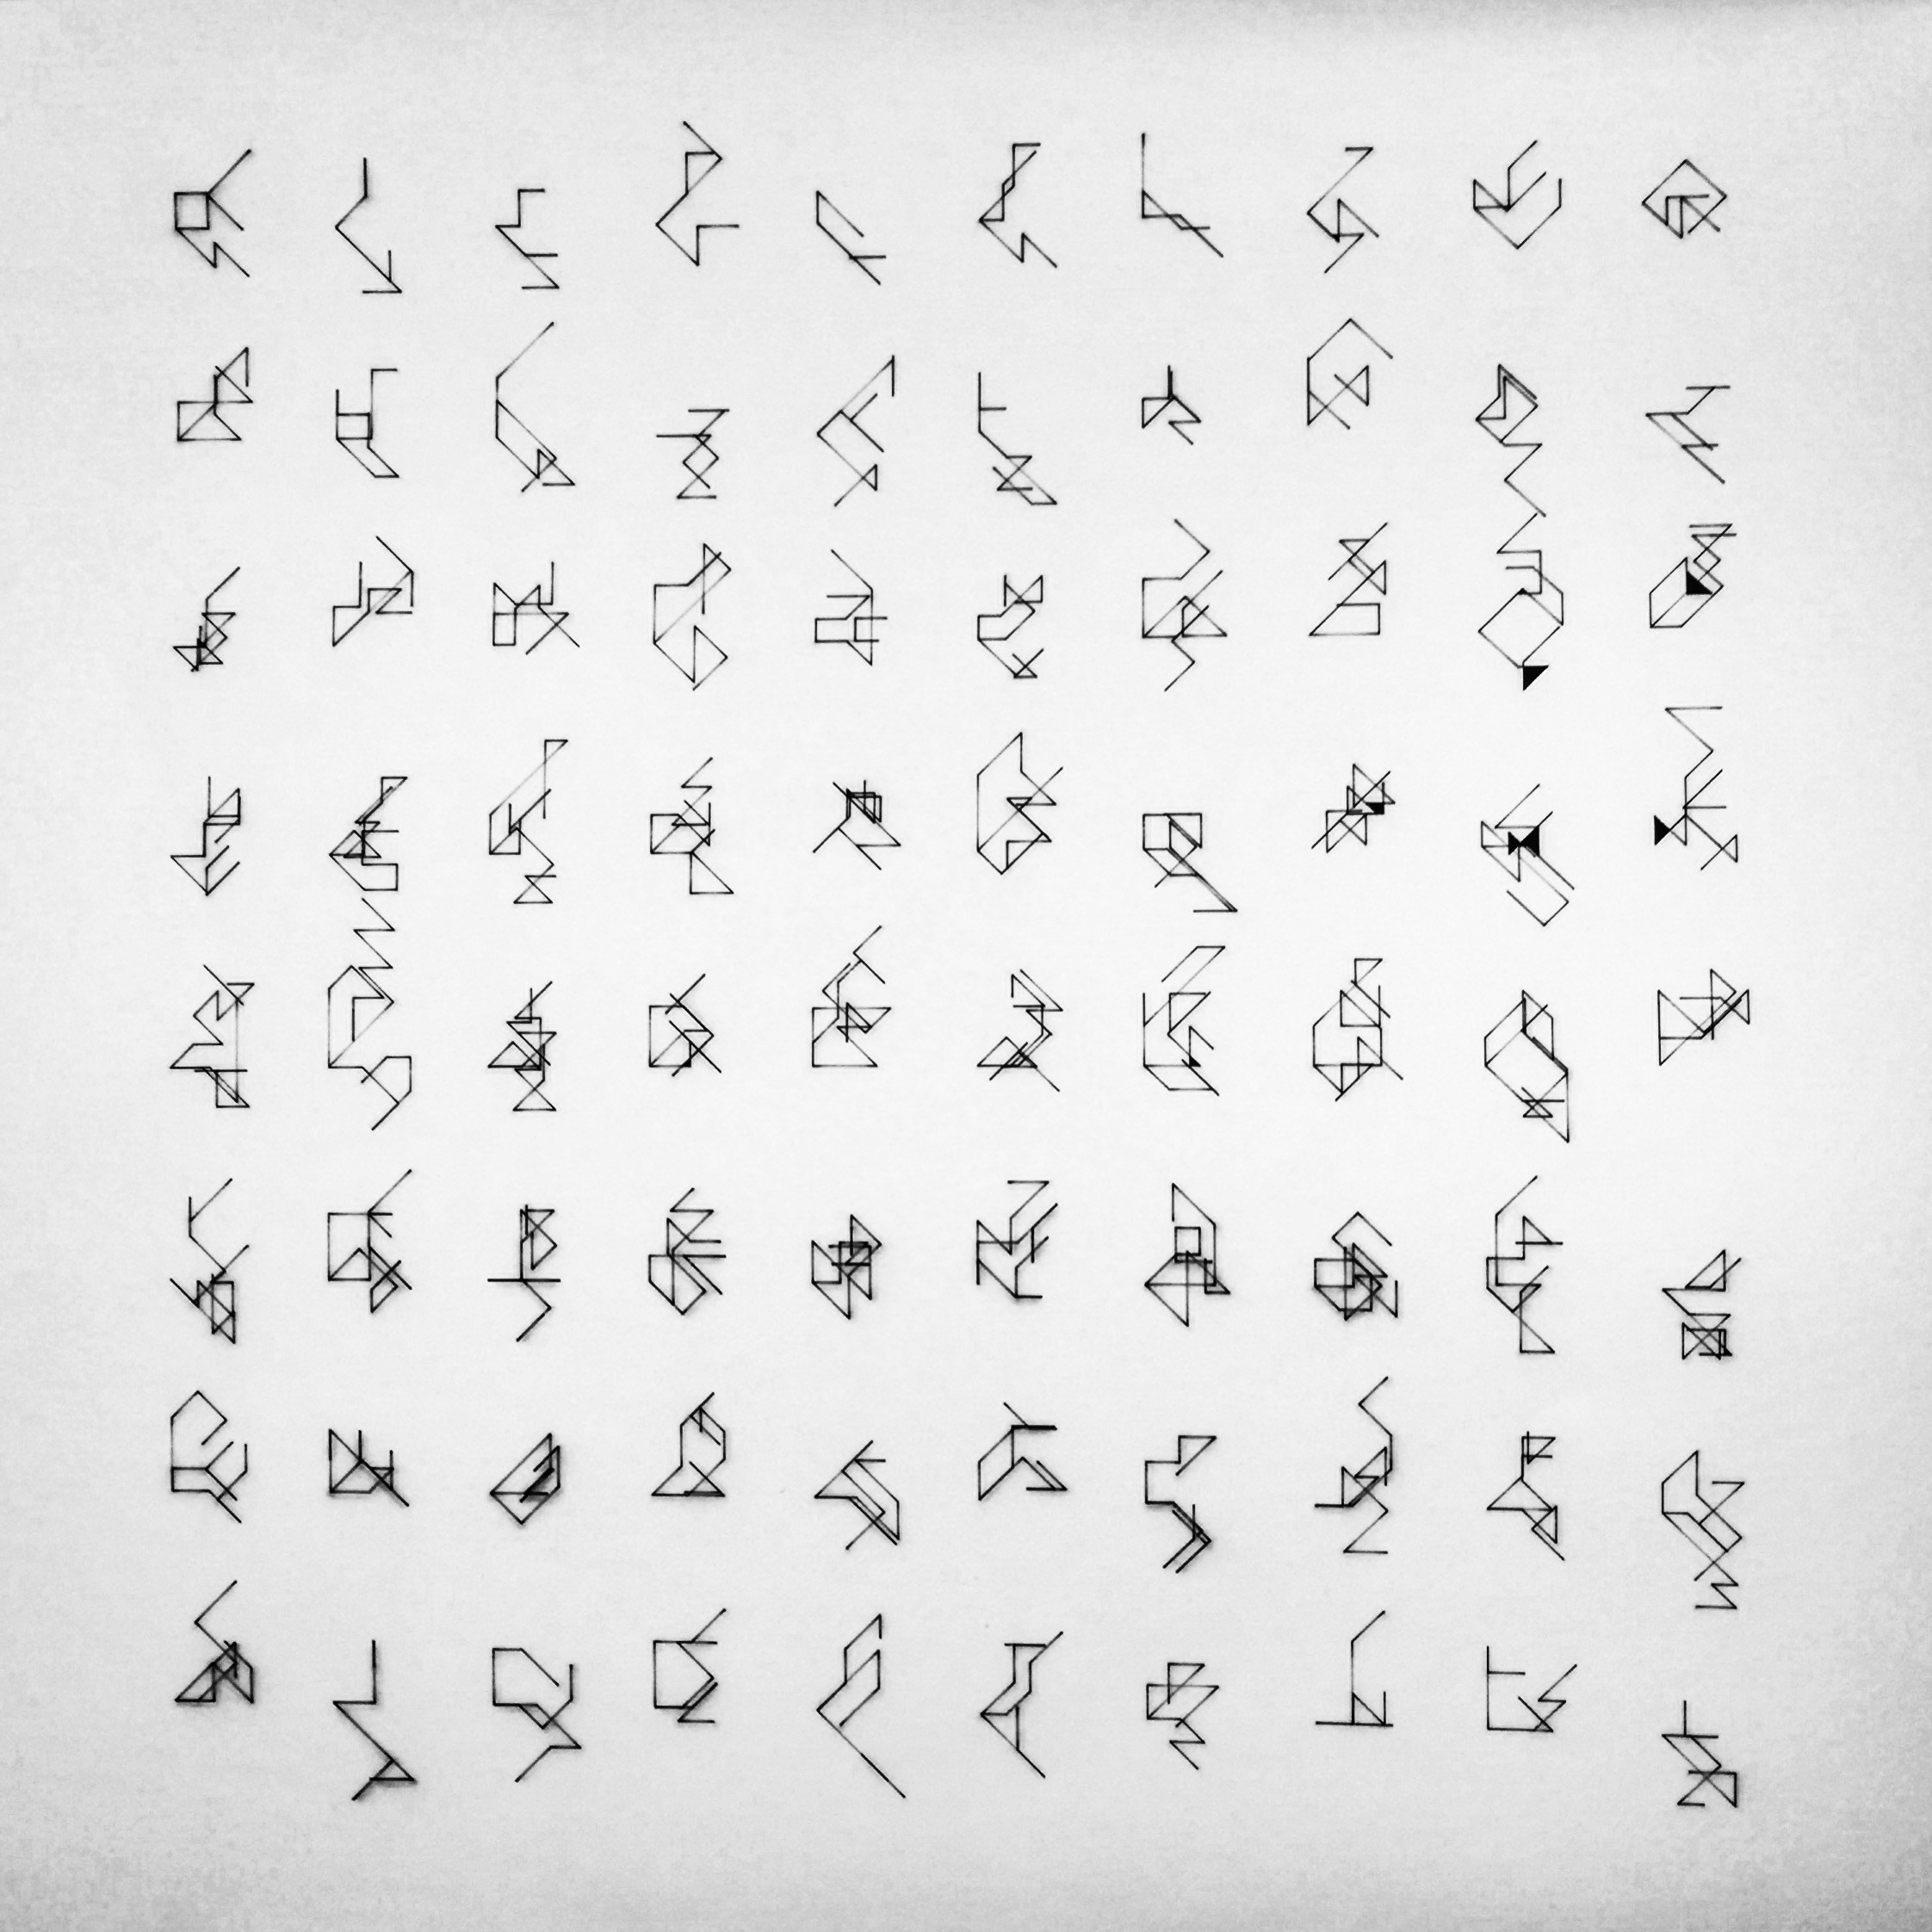
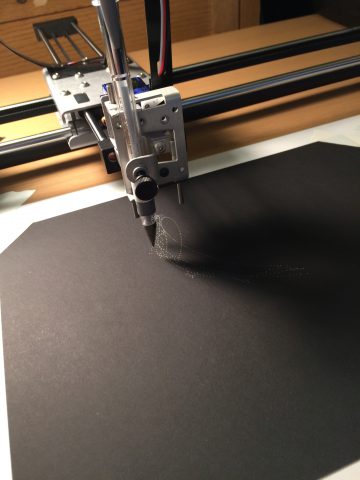
 plotter
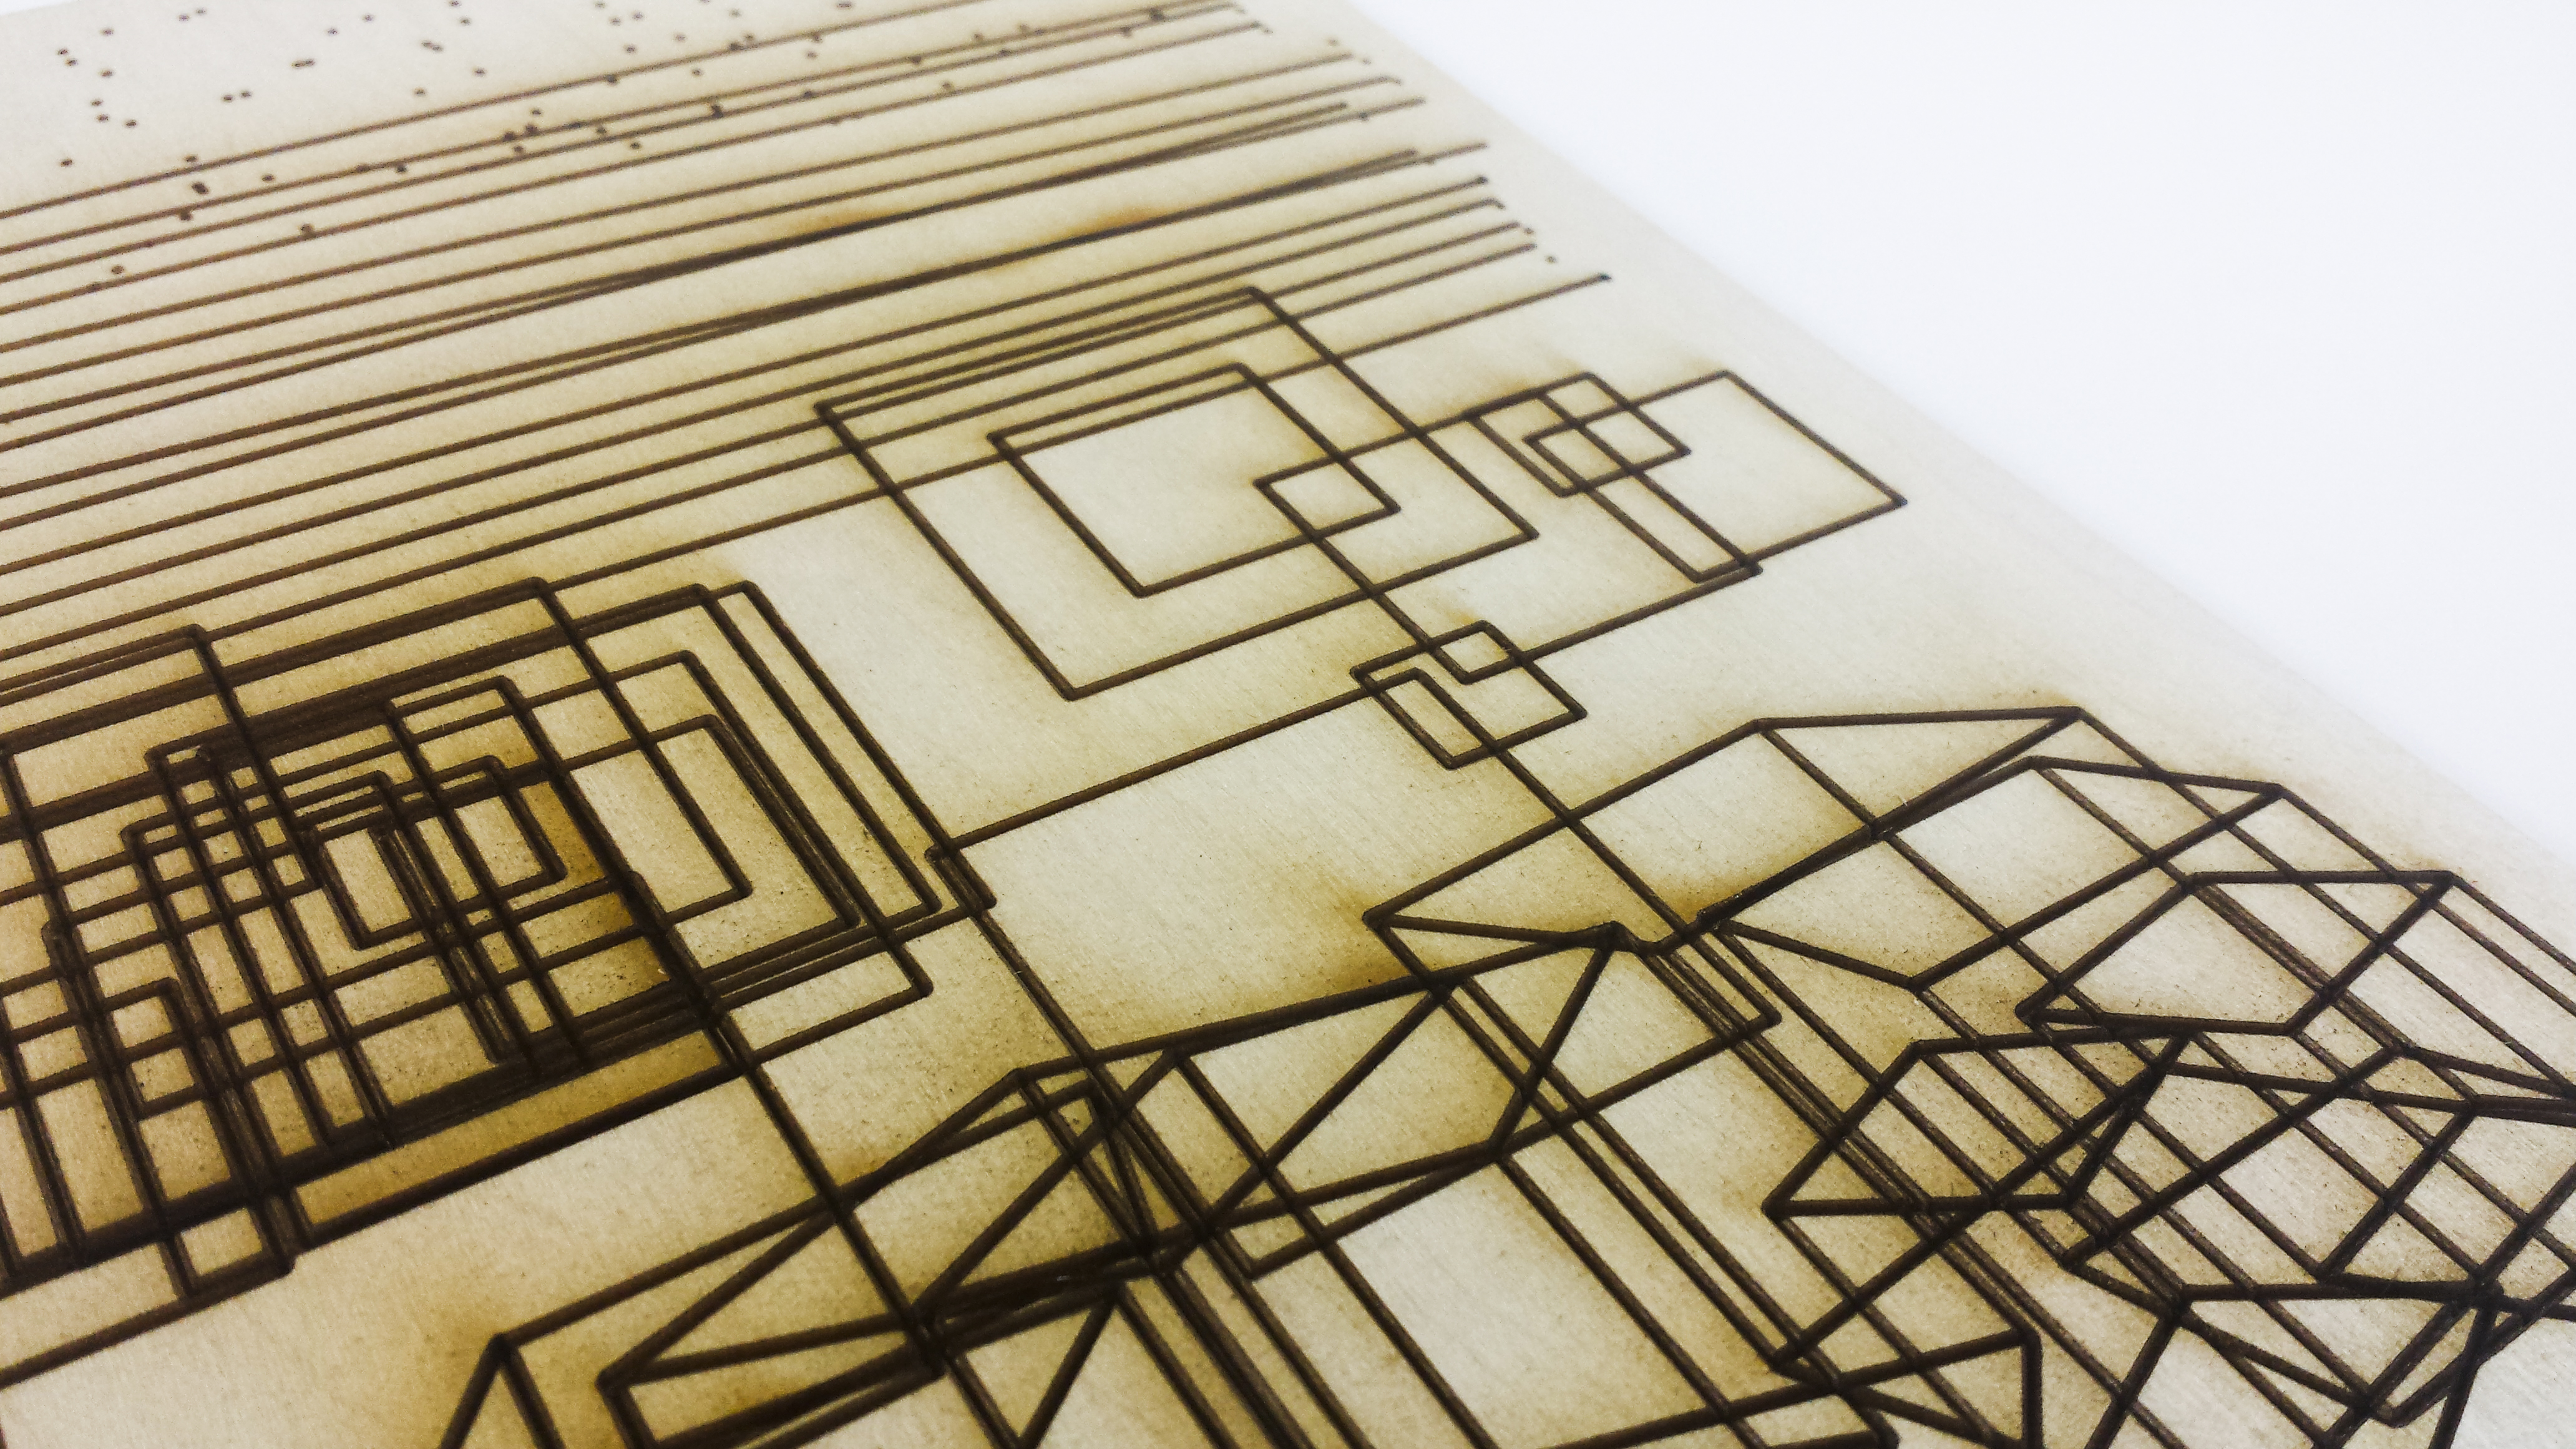
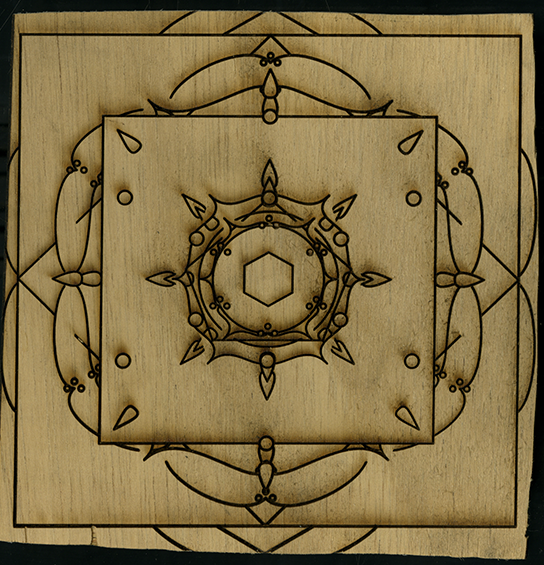
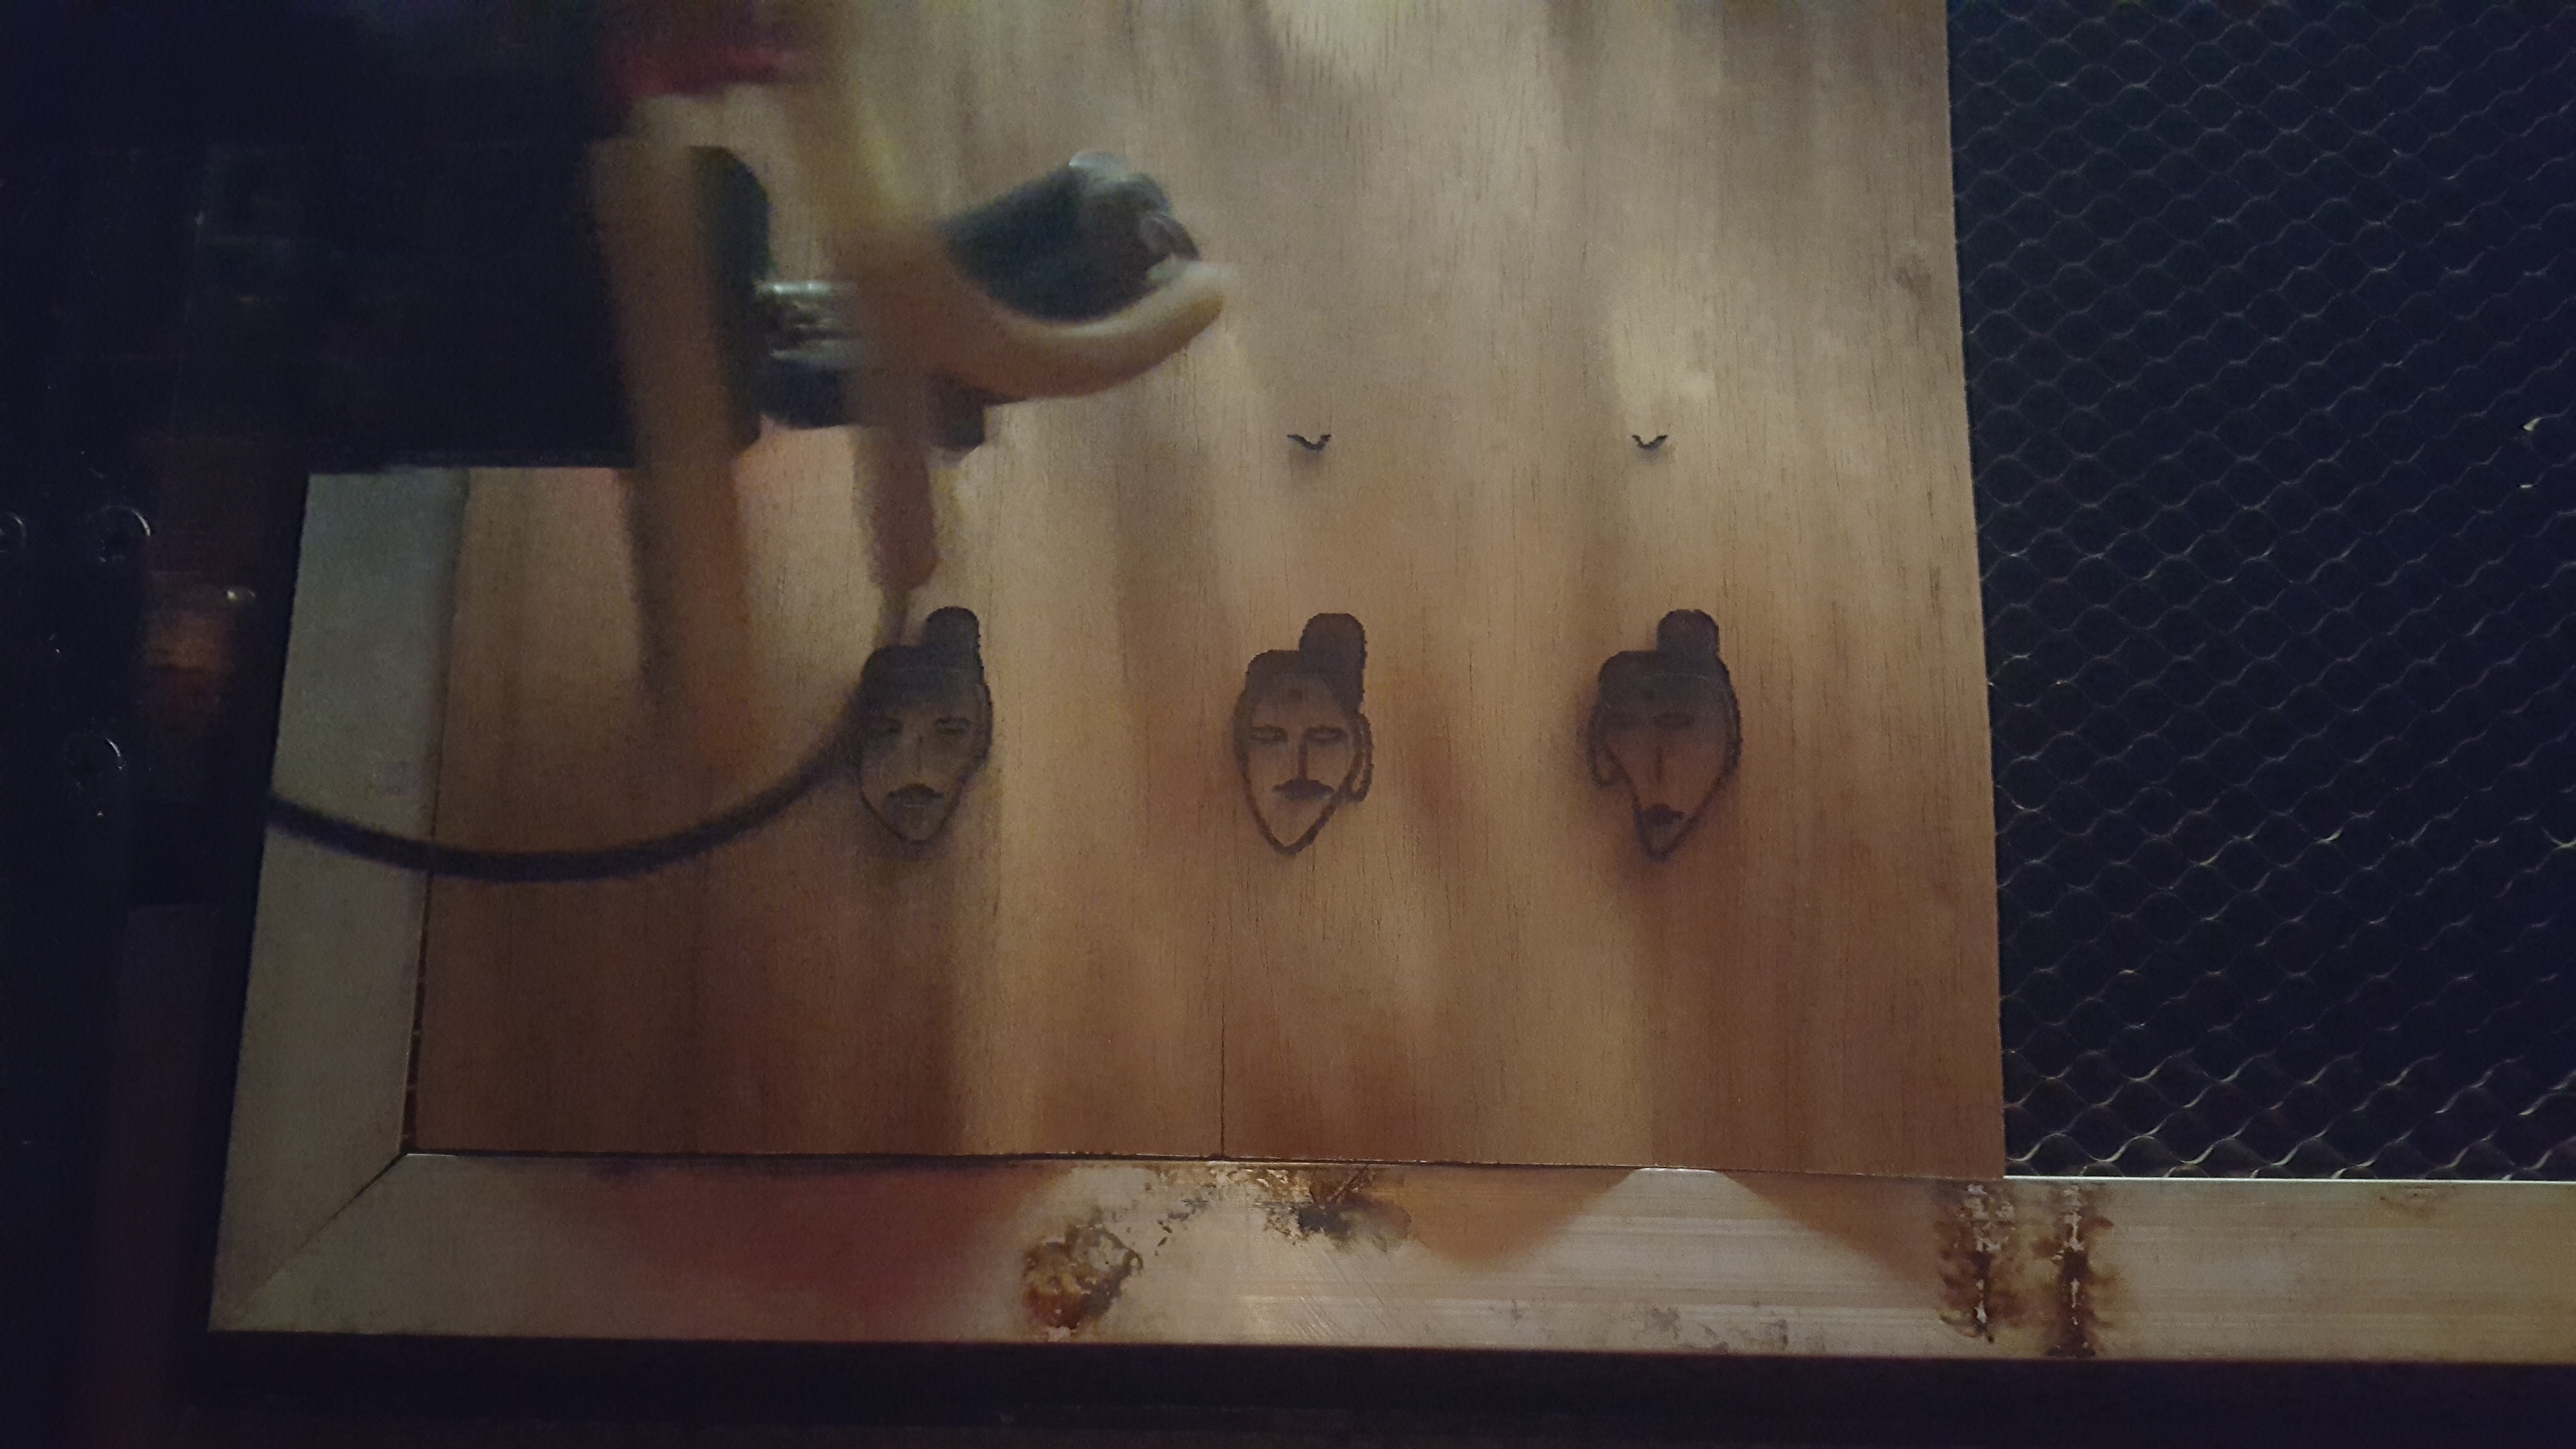
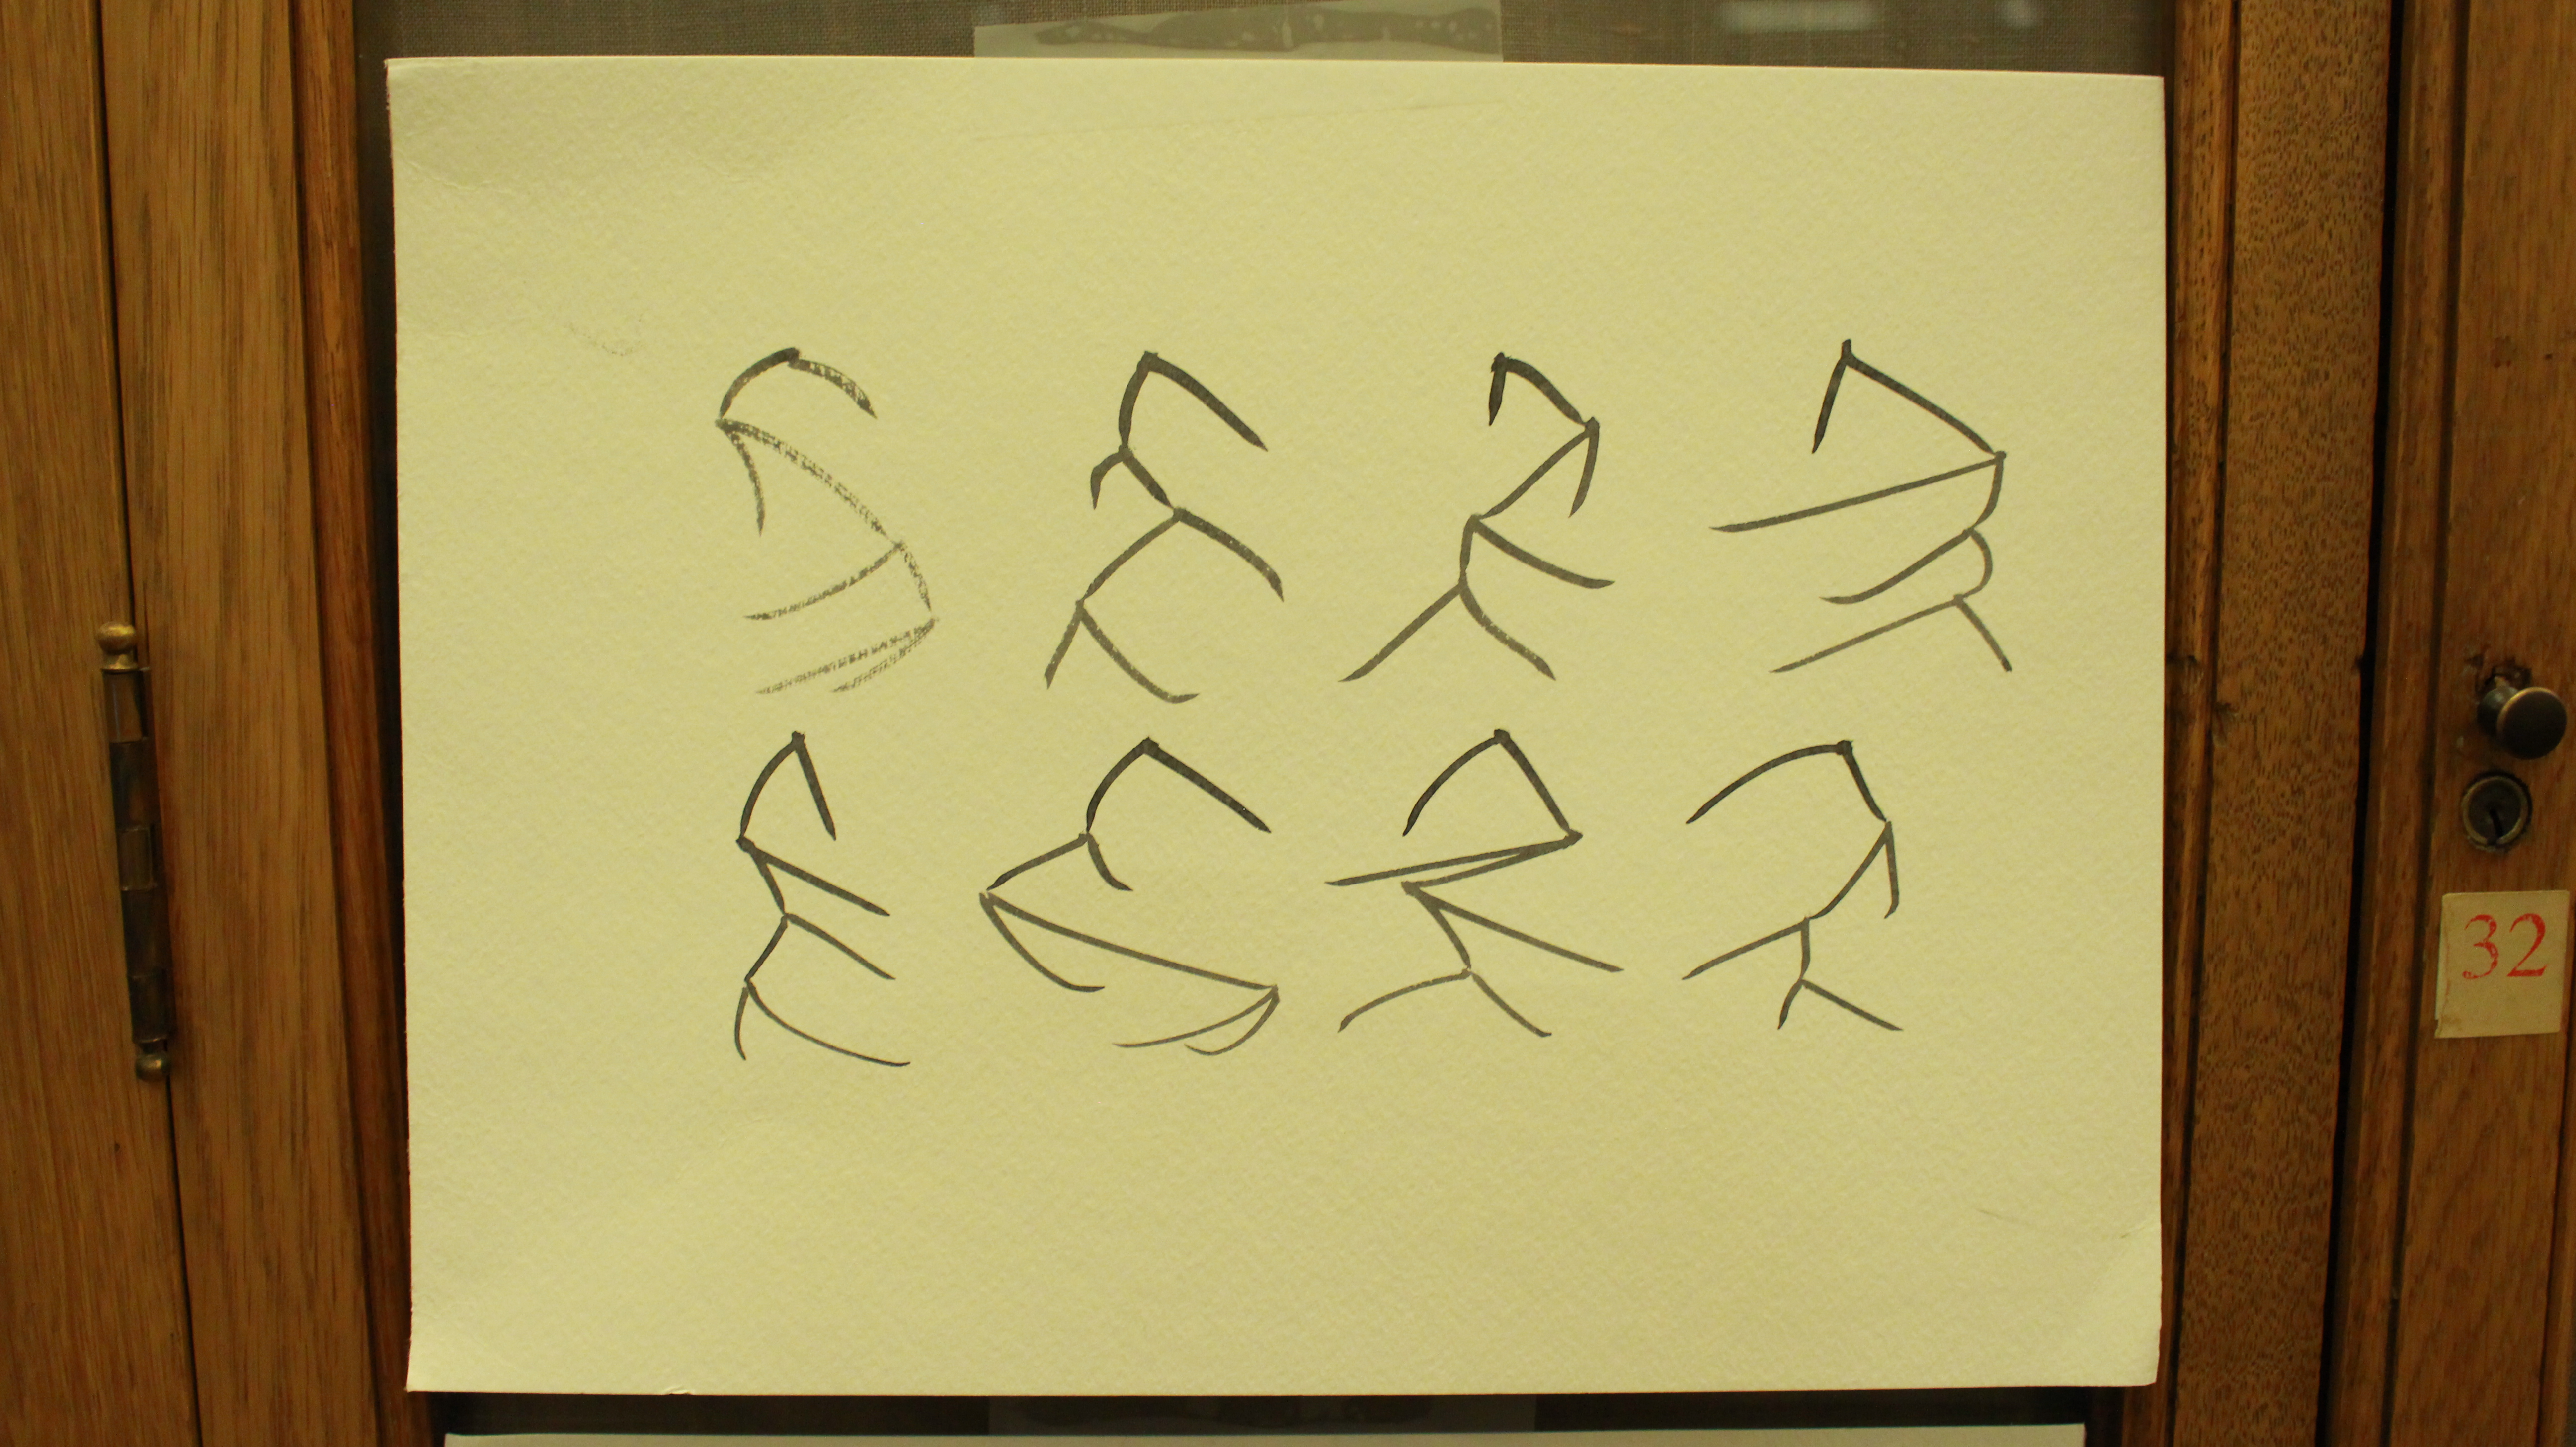
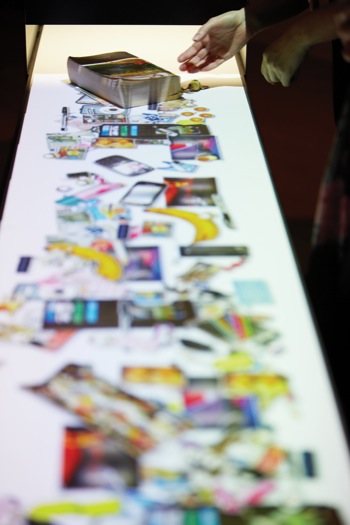
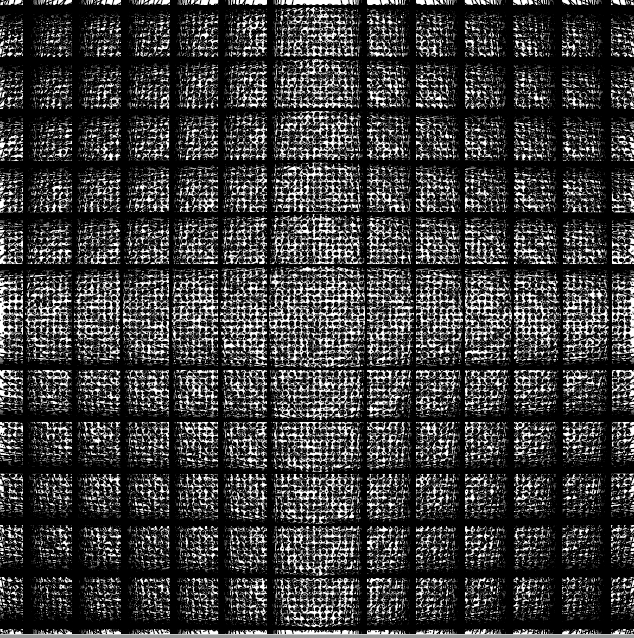
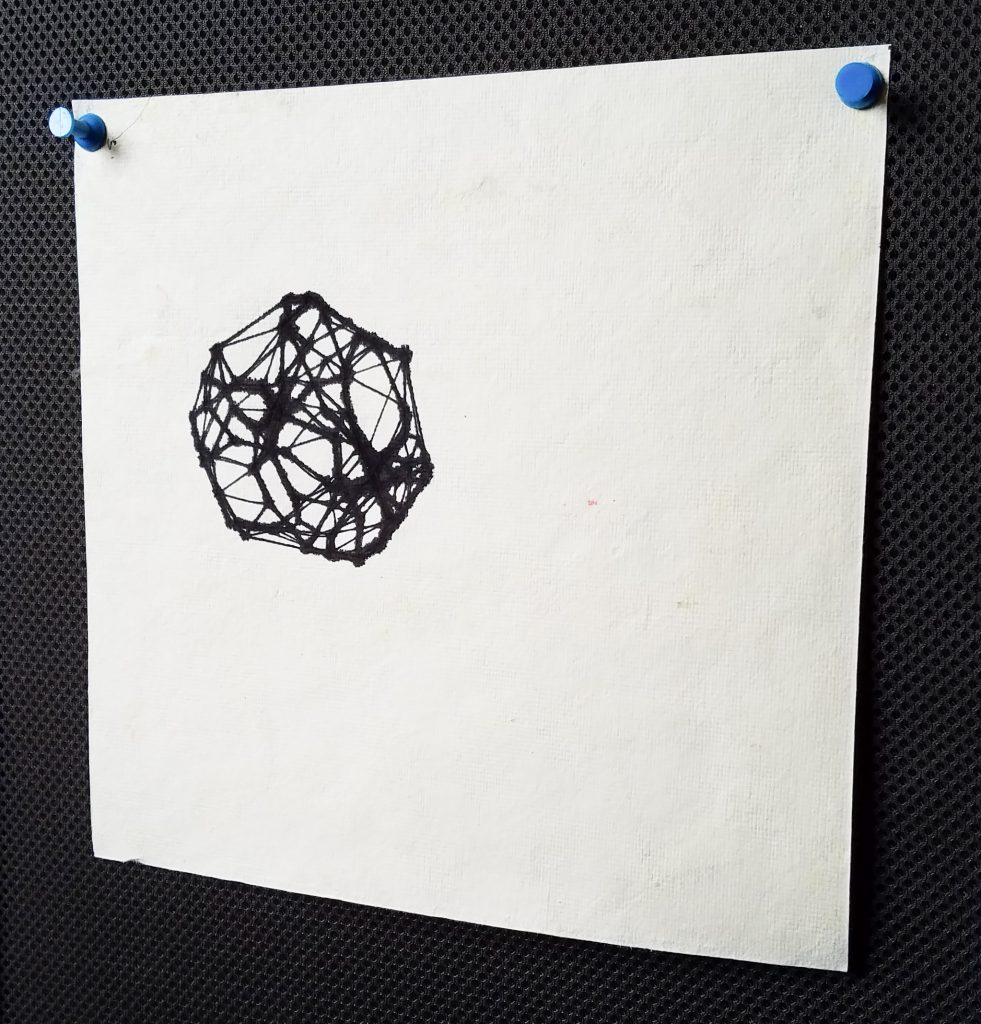
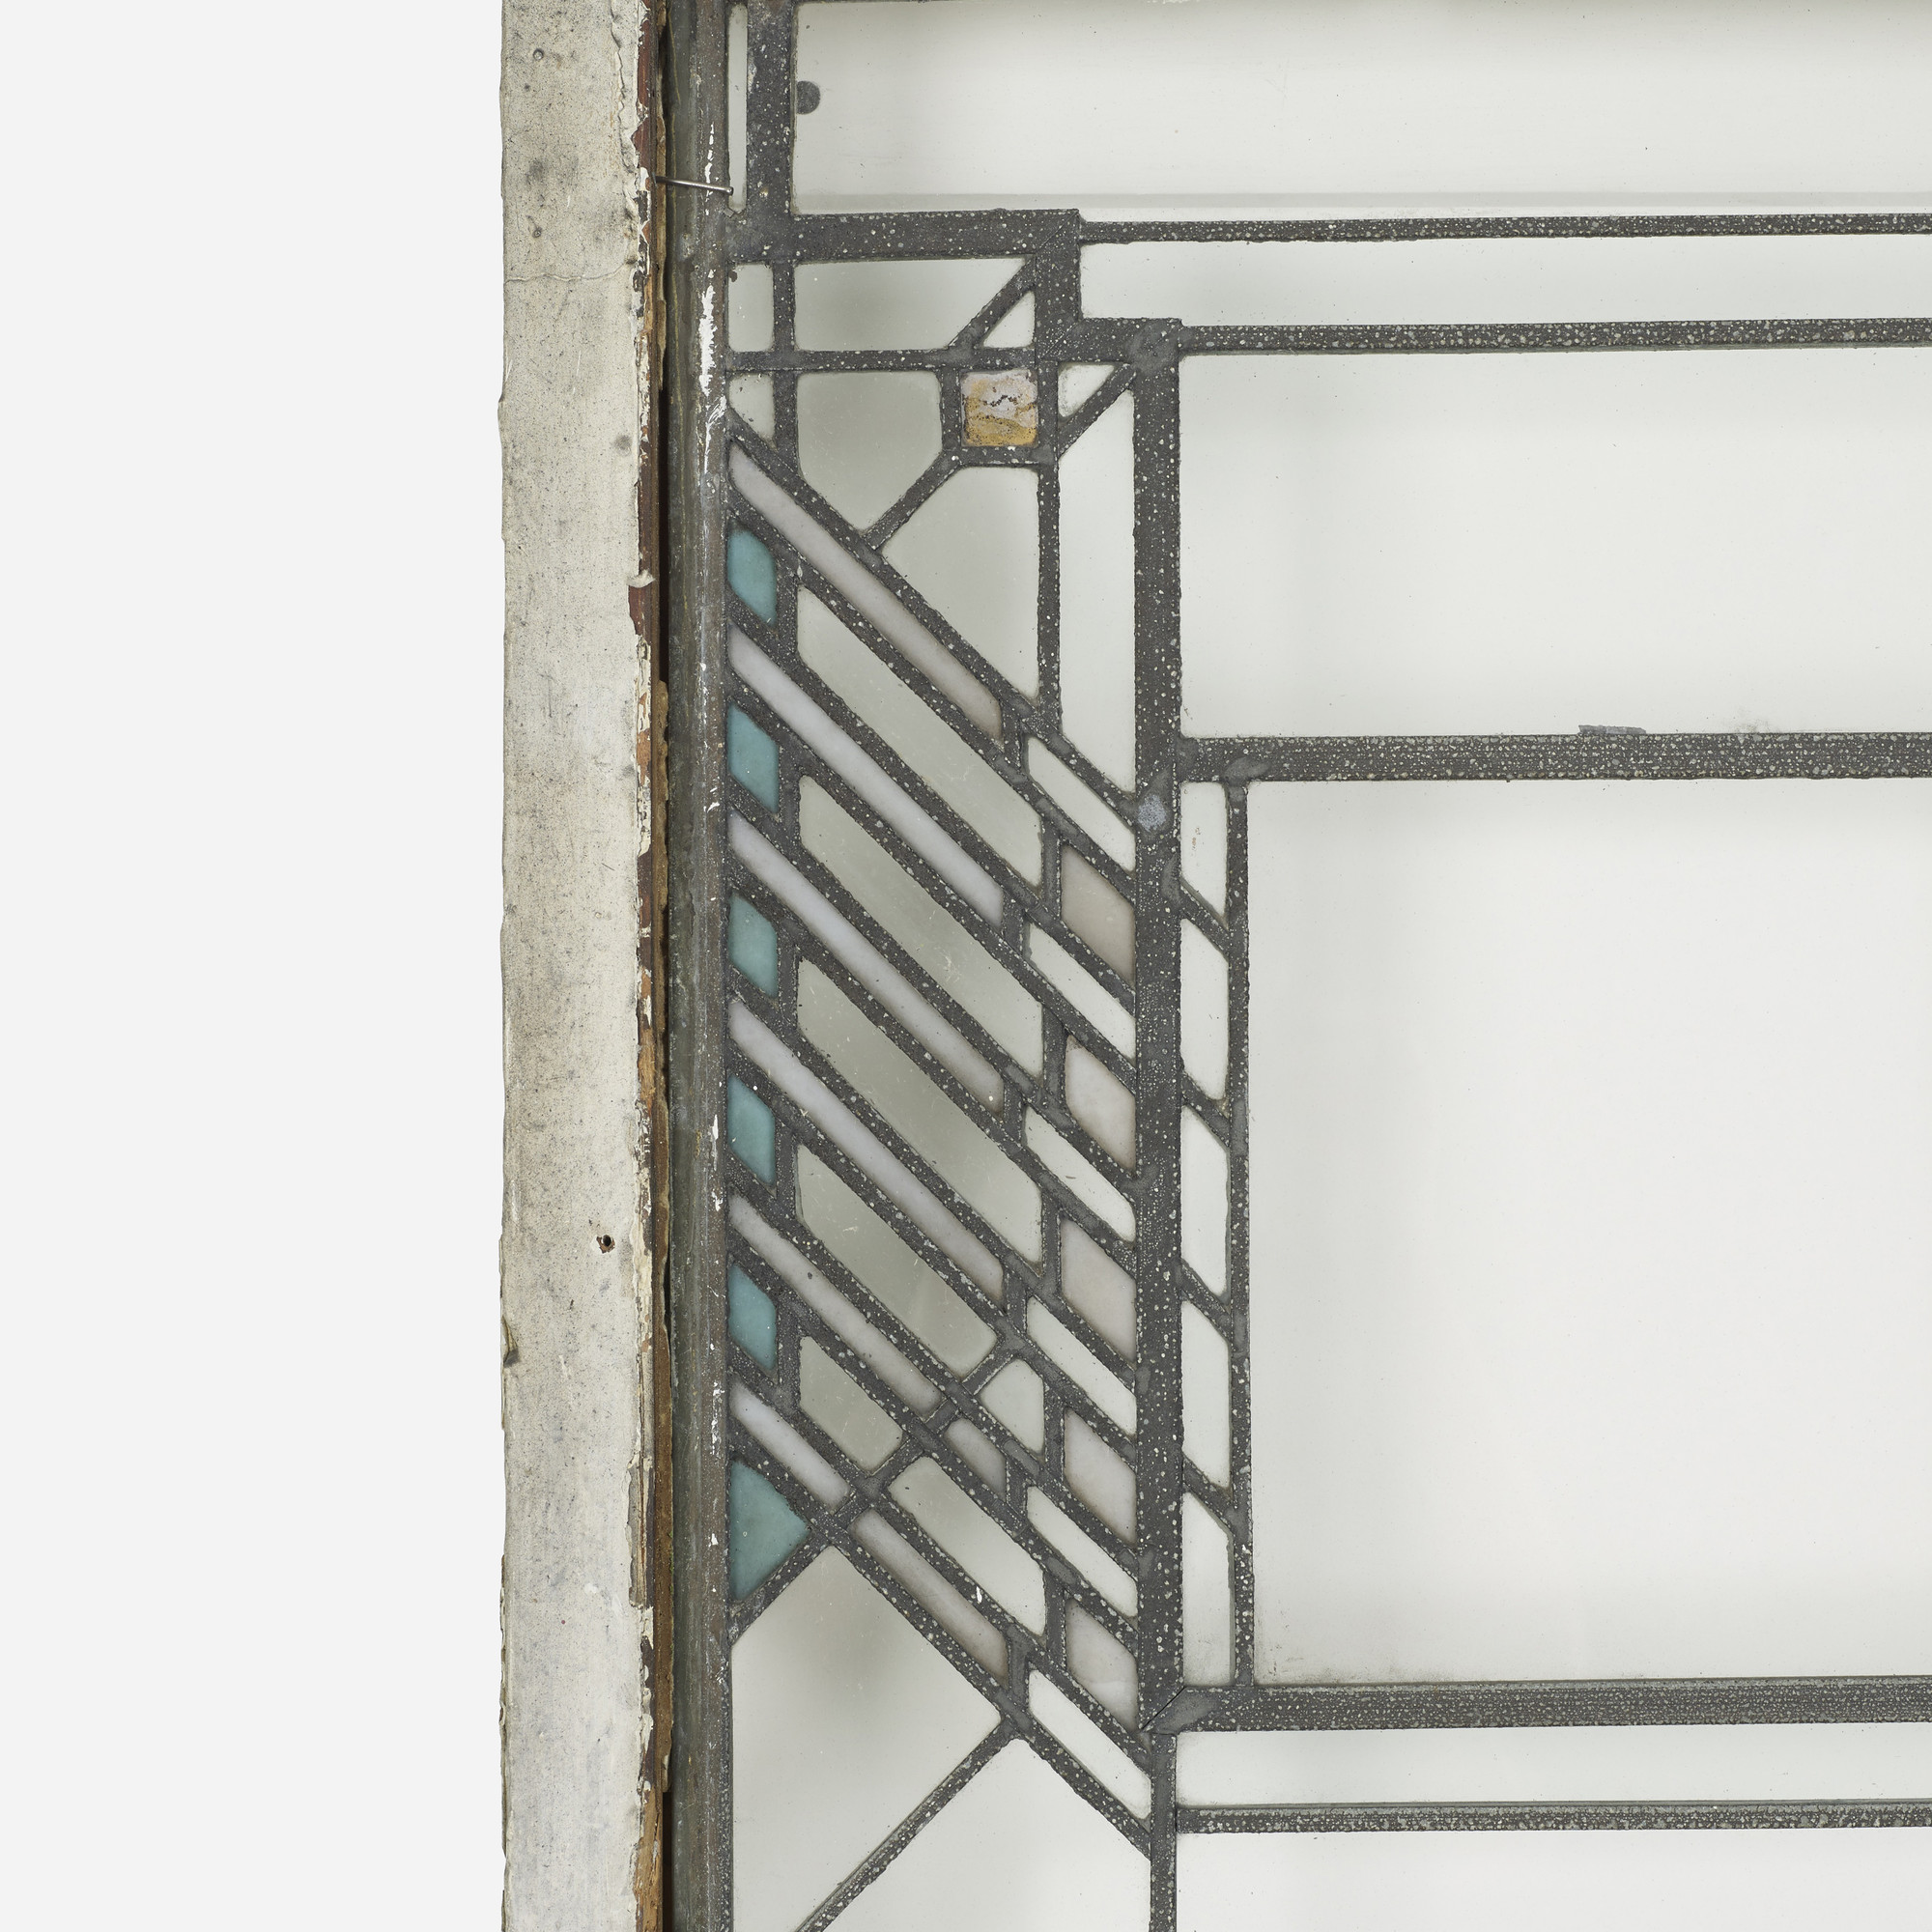
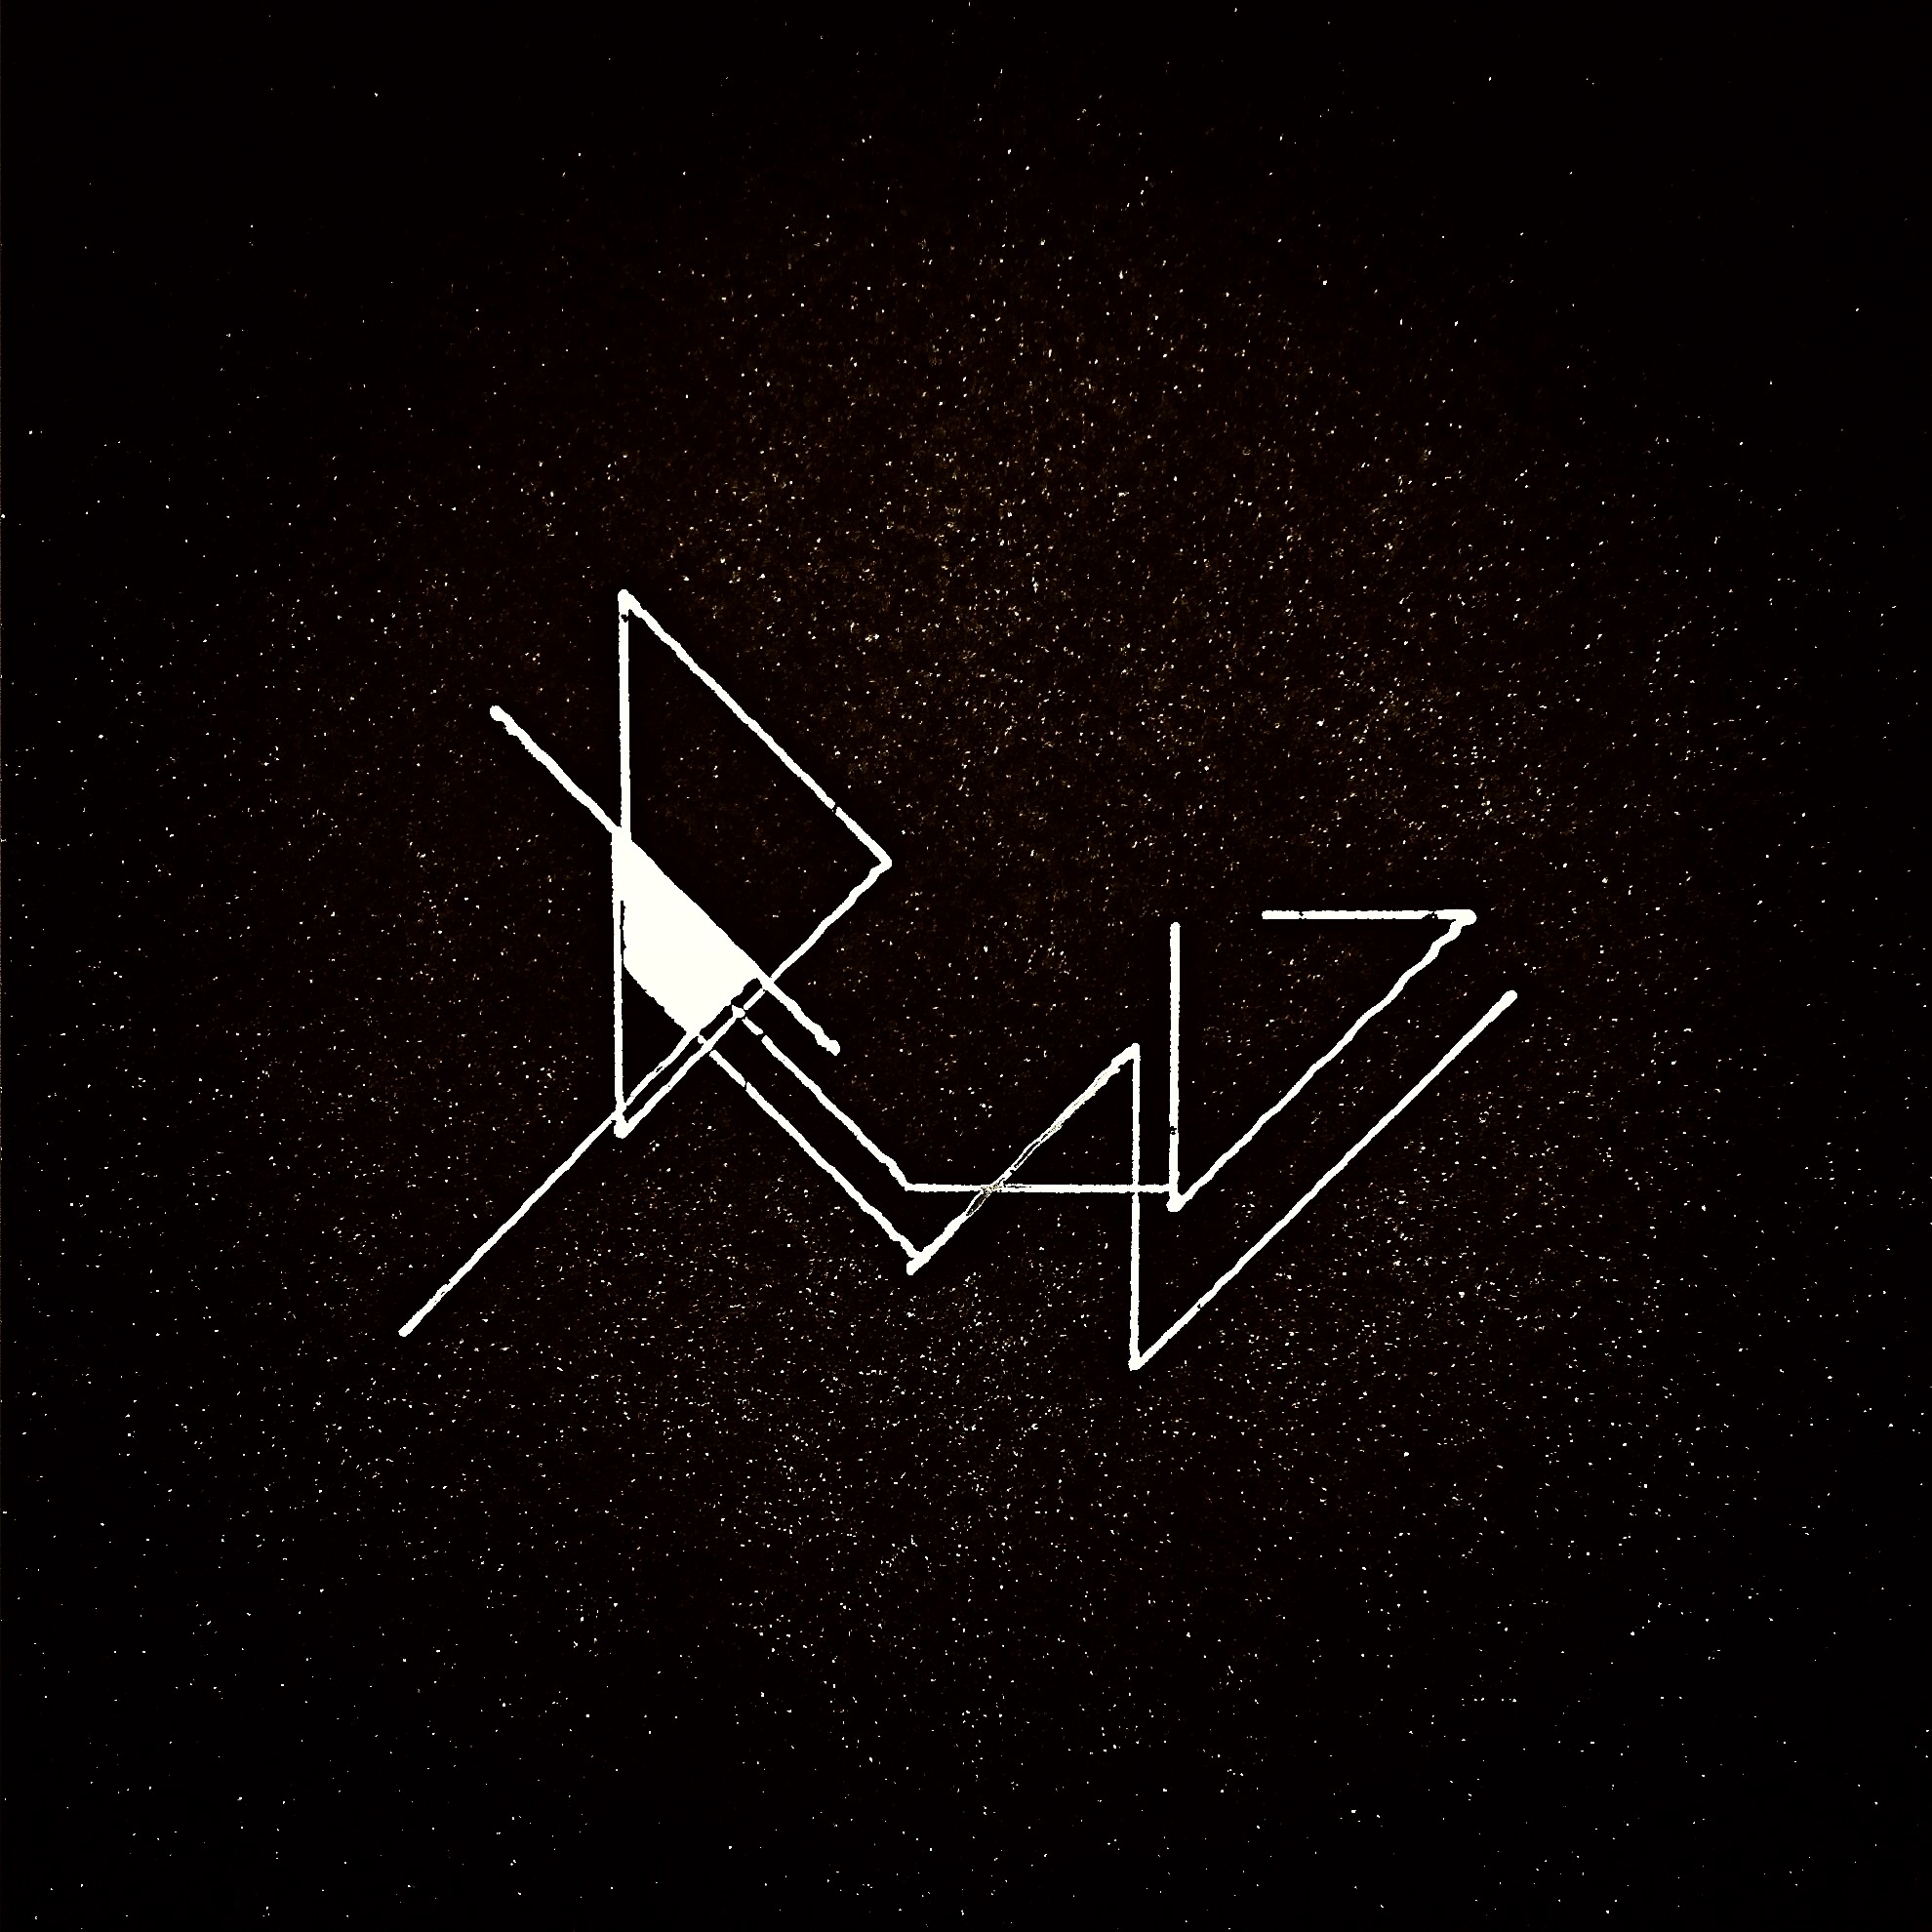
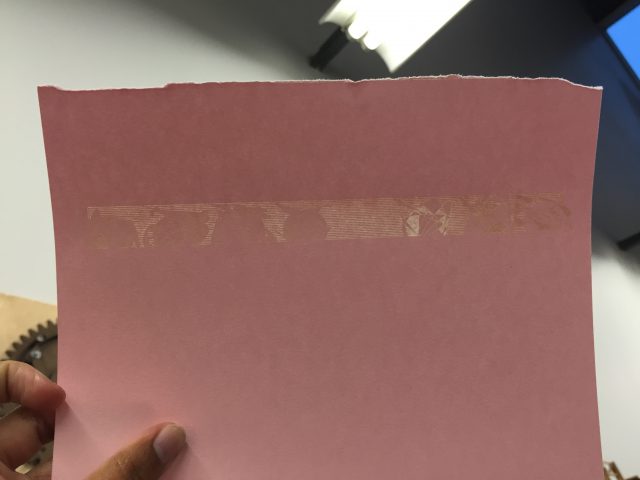
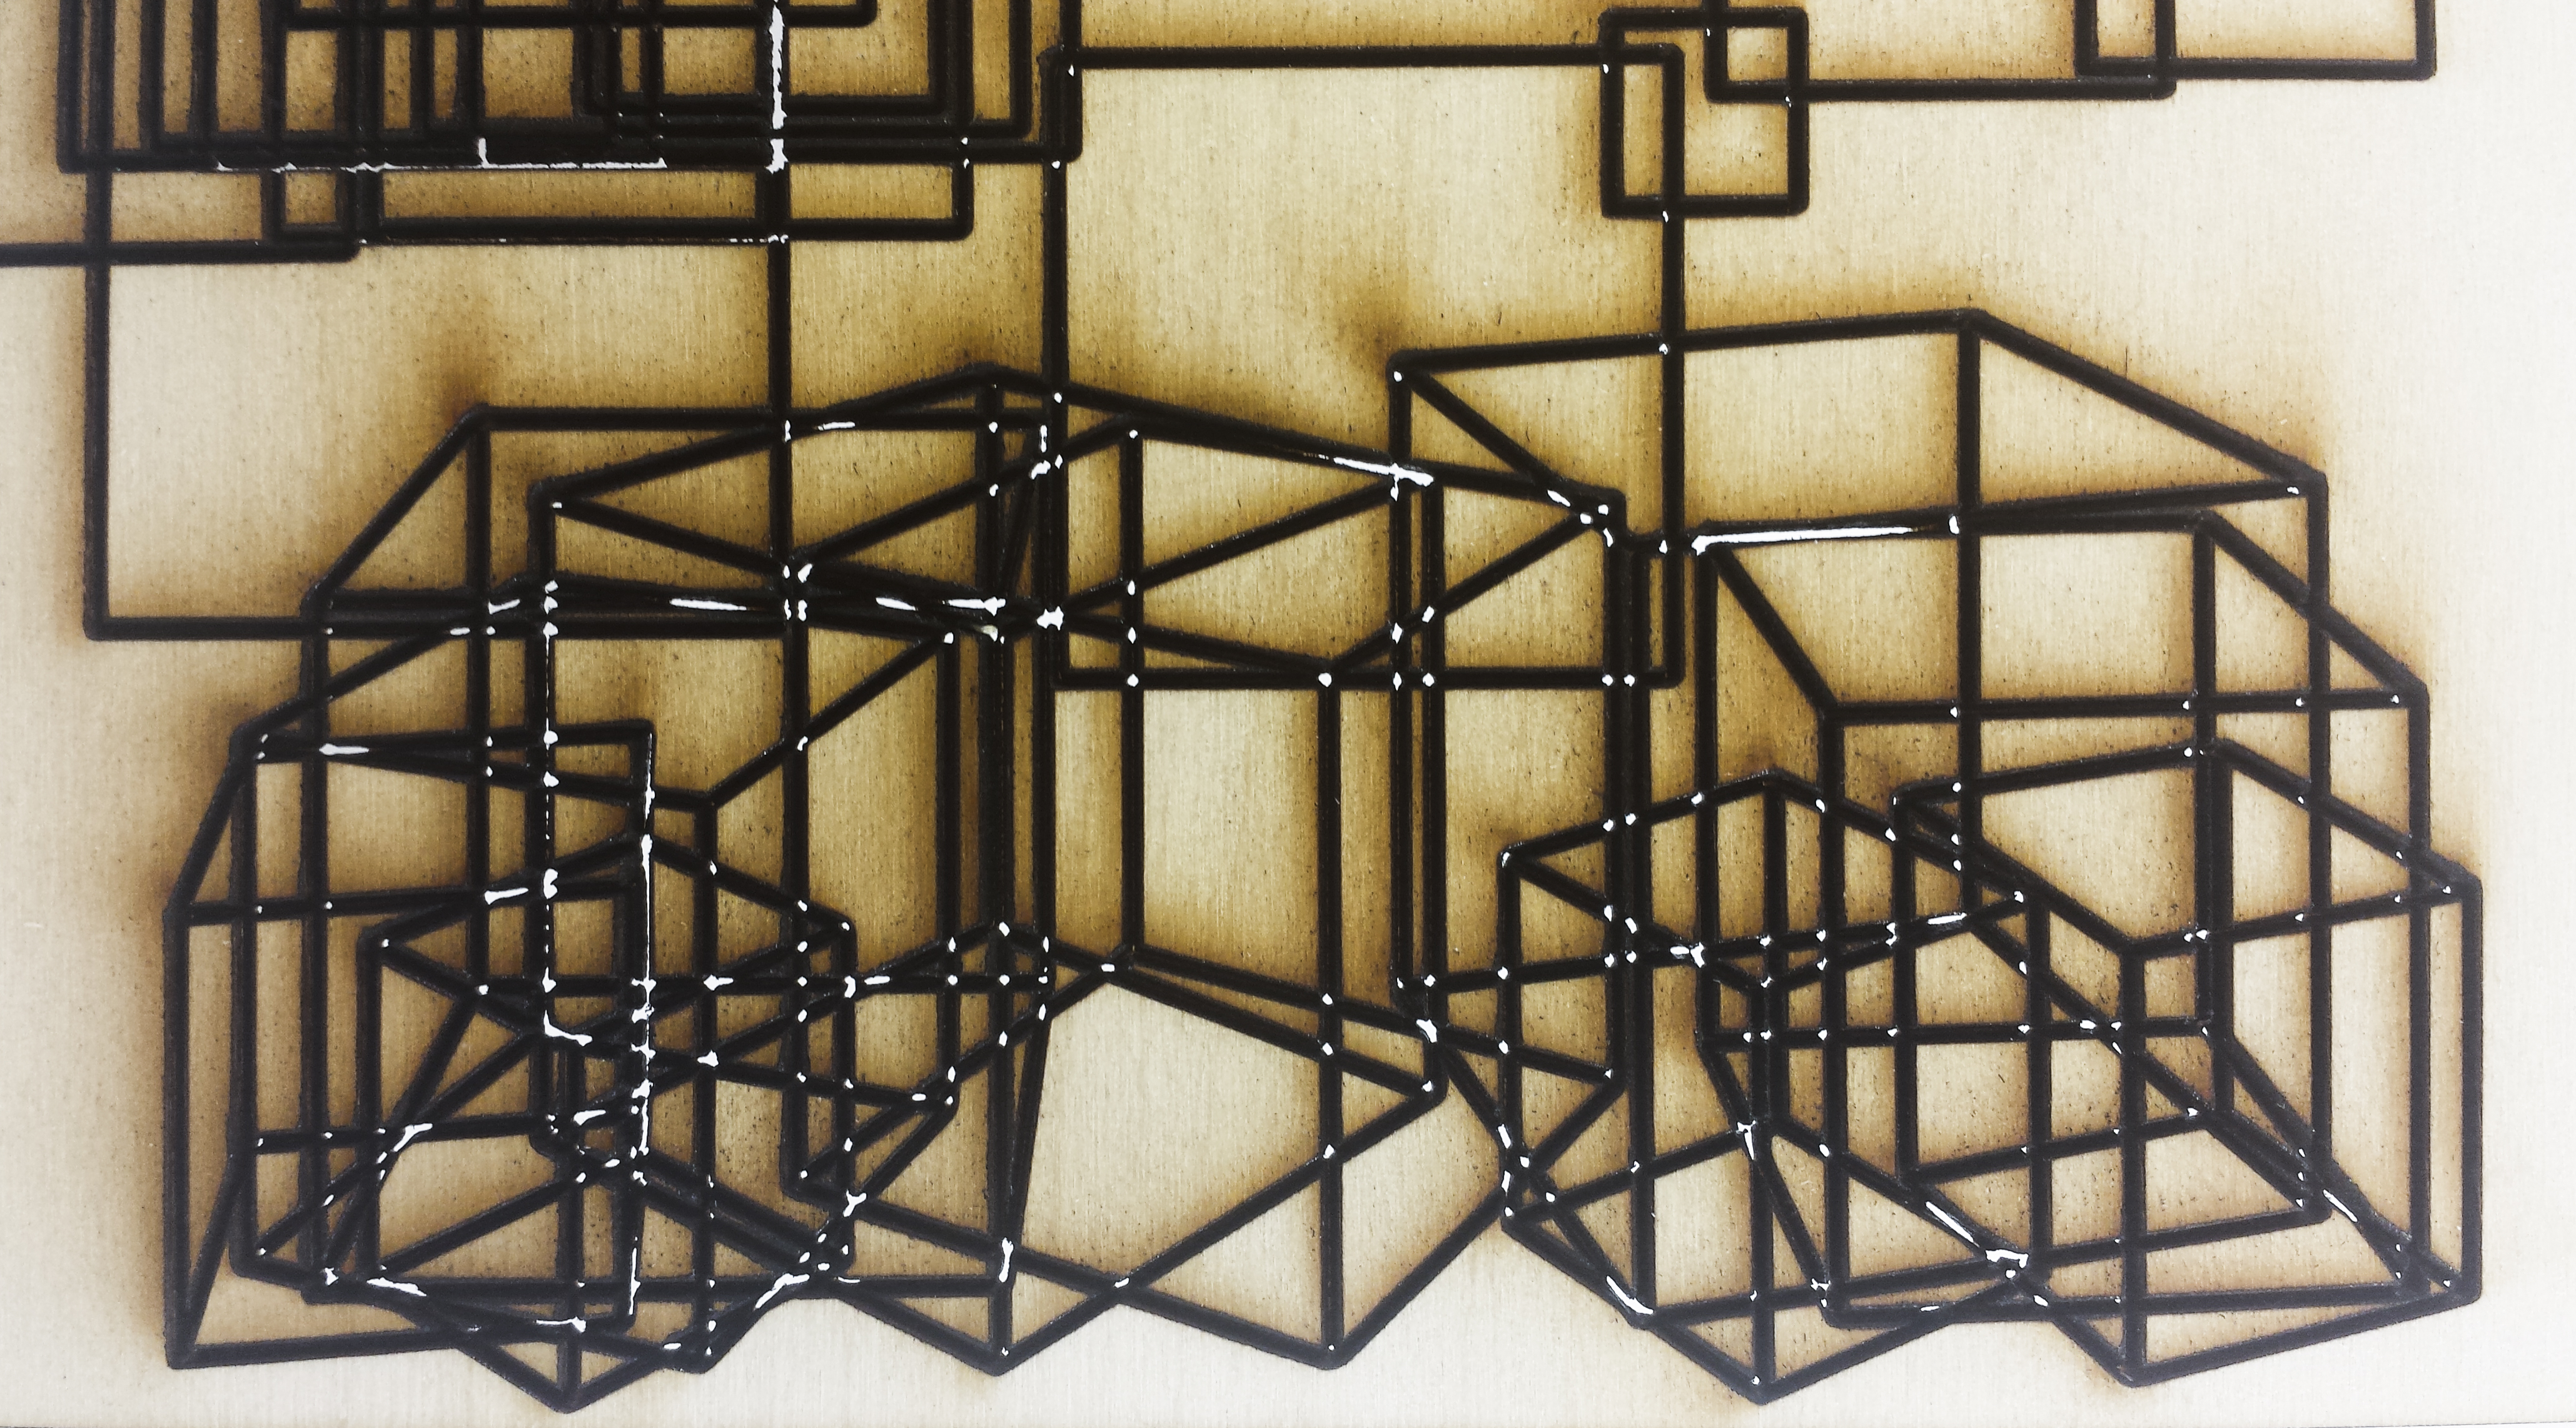 Power was a little too high for my first laser cut, but it was interesting to see certain parts poking through.