Deliverables 04 (Due 9/30)
This set of Deliverables is due on Friday, 9/30 at the beginning of class. The primary open-ended project is the Line Plotter Composition; you’ll need to arrange a time to plot your drawing in the STUDIO for Creative Inquiry during the week.
This set of deliverables has three components. These are Due 9/30.
- Response to Clock Feedback.
- Looking Outwards: Interactive Art
- Composition for a Line Plotter
1. Response to Clock Feedback.
In a blog post, please write a brief response (of 50-100 words; just a few sentences) responding to the feedback you received on your clock project. What’s your takeaway?
- Title your post, nickname-Clock-Feedback.
- Categorize your post, ResponseToClockFeedback.
2. Looking Outwards #04: Interactive Art
From blogs and any other sources, identify and discuss a project which presents a specific form of interactivity or real-time processing that you find interesting. Try to identify forms of interaction that beyond solo screen experiences (though those are OK too).
- Title your blog post nickname-LookingOutwards04.
- Categorize your blog post LookingOutwards04.
Some places to look:
- The Prix Ars Electronica archive for the “Interactive Art” category
- Ars Electronica (YouTube channel)
- Creative Applications
- Creators Project
- Media Art Tube
- Networked Performance
- Vimeo: openFrameworks
- Vimeo: Processing
- ZKM Video Archive
Here are some artists to consider:
Allison Burtch, critical new-media practitioner and educator
Andrea Polli, sound/interative media artist
Béatrice Lartigue, interactive artworks and interventions
Camille Utterback, interactive artworks and permanent public installations
Caroline Record, sound + new media installation/performance artist
Christine Sugrue, artist of poetic interactive new-media installations
Danny Rozin, creator of interactive mirrors
David Rokeby, pioneer of audiovisual interactive art
Eva Schindling, installations, sculpture and performance
Heather Kelley, indie game developer and educator
Karolina Sobecka, artist/developer of interactive media installations
Katherine Bennett, educator and new media artist
Lauren McCarthy, new media artist and creator/lead-developer of p5.js!
Luisa Pereira, creator of interactive audiovisual systems and machines
Lynn Hershman-Leeson, pioneer of interactive narrative art, active since mid-1970s
Mimi Son, creator of interactive artworks with novel displays
Molmol Kuo, artist-designer of images, kinetics and interactive sculptures
Natalie Jeremijenko, pioneer of critical making in diverse media
Nova Jiang, interactive sculpture and installation
Phoenix Perry, indie game developer and educator
Rafael Lozano Hemmer, a better-known interactive artist
Scott Snibbe, experimental/playful/mindful interactive art
Theo Watson & Emily Gobeille, interactions for young publics
Toshio Iwai, pioneer of interactive audiovision
Zachary Lieberman, interaction artist, co-founder of OF and YesYesNo
3. A Composition for a Line Plotter.
You are asked to write code which generates a composition for a line plotter.
This section is divided as follows:
- Six Premises for a Plotter Drawing
- Recommended Process and Considerations
- Technical Advice and Resources
Six Premises for a Plotter Drawing
Below are five possible starting points or premises. (This is not a comprehensive list.)
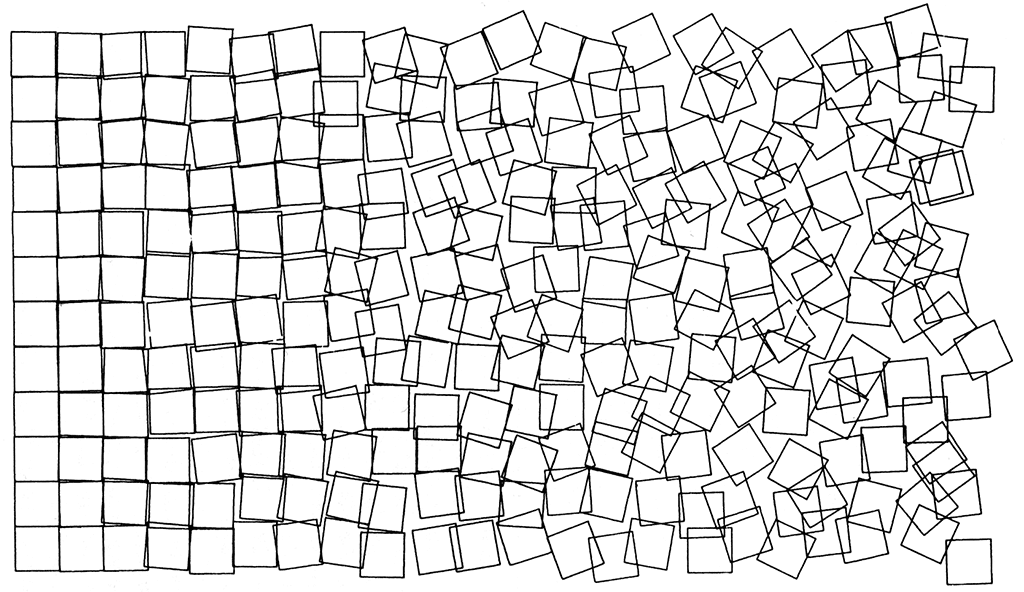
Premise I. Develop a composition which presents a gradient or other transition from order to disorder. The artwork Schotter by Georg Nees (1965) is an example of this. (Nees was the first person to ever exhibit artwork created with a computer; his programs were developed on punched paper tape before being physically generated by a drawing machine, the Zuse Graphomat Z64.)
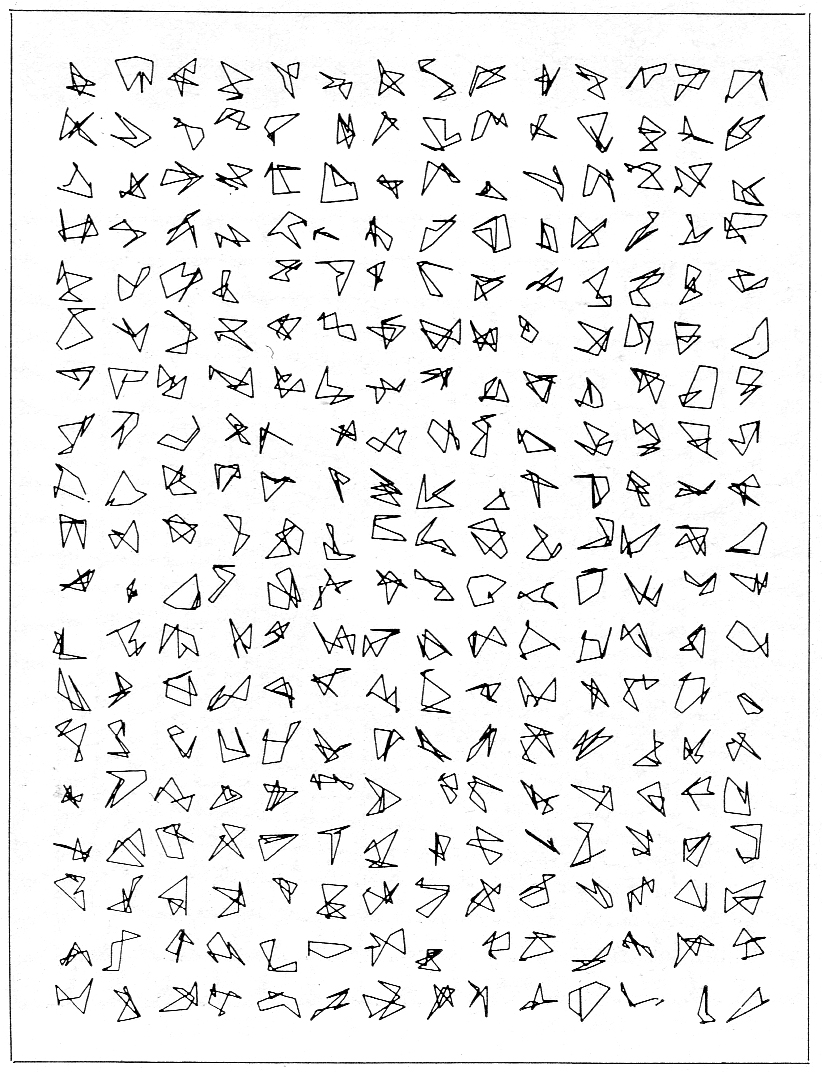
Premise II. (Or) Develop a composition which presents randomized variations of a parametric design. (For example: you might generate a collection of snowflakes, or little monsters). The artwork 8-Ecke (“8-cornered shapes”), also by Georg Nees (1964) is an example of this:
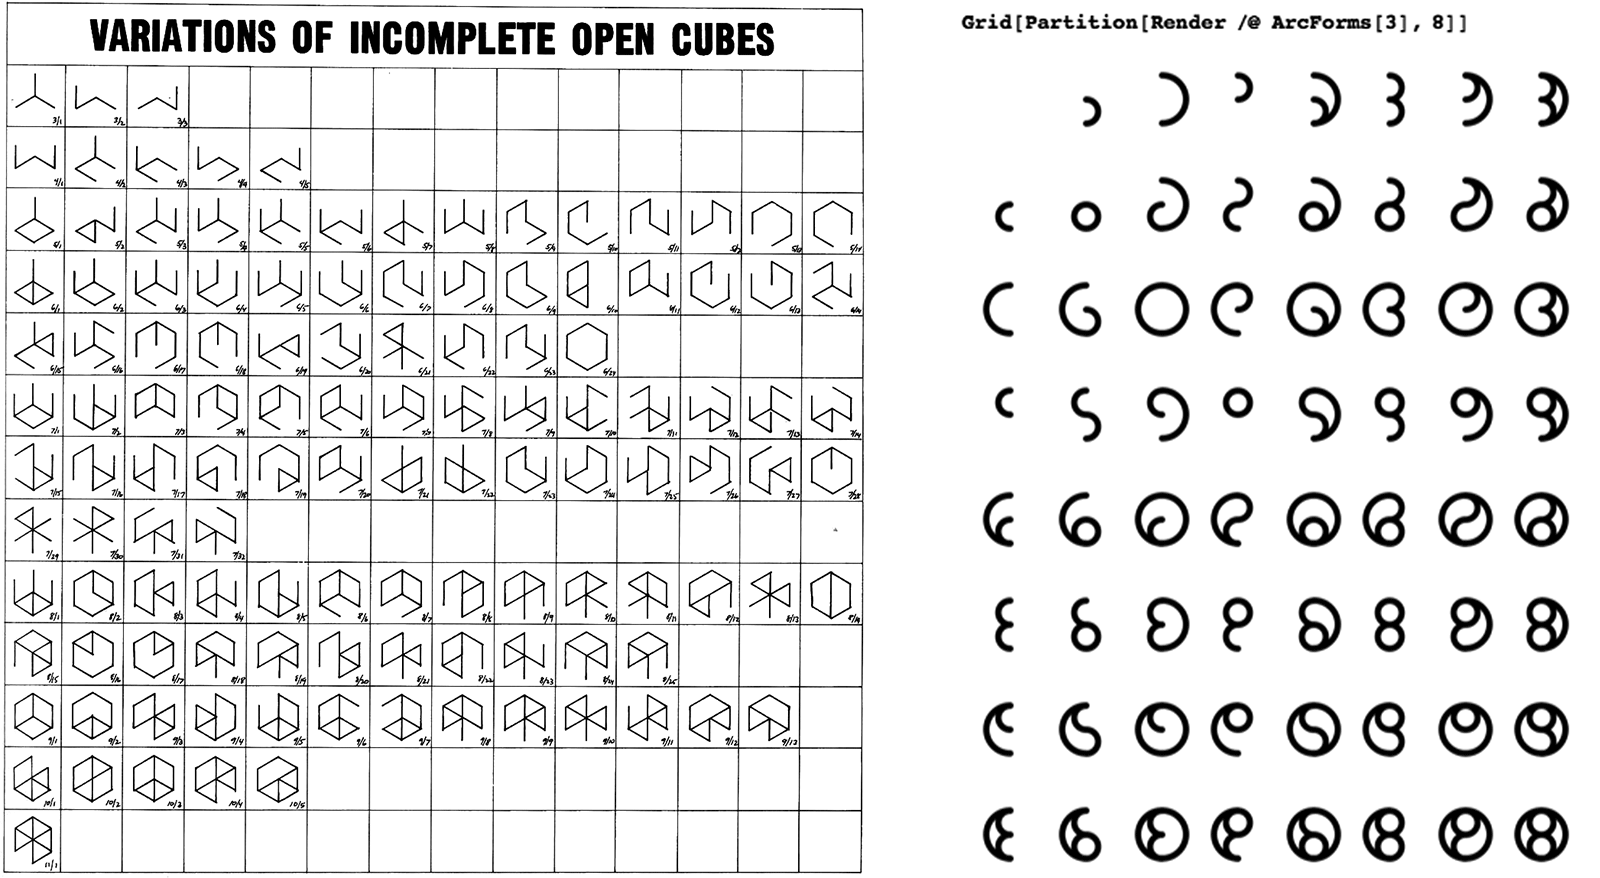
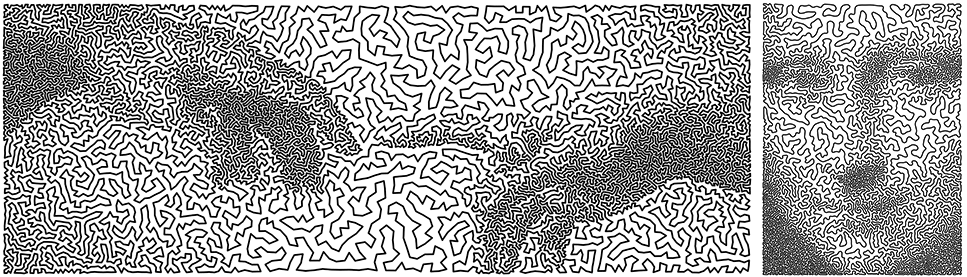
Premise III. (Or) Conduct an exploration of a “Minimum Inventory, Maximum Diversity” system, a term coined by Peter Pearce in Structure in Nature Is a Strategy for Design (1978). Christopher Carlson writes that “a minimum inventory/maximum diversity system is a kit of modular parts and rules of assembly that gives you maximal design bang for your design-component buck. It’s a system that achieves a wide variety of effects from a small variety of parts. Nature excels at this game: every one of the many millions of natural proteins is assembled from an inventory of just 20 amino acids.”
The artwork Variations of Incomplete Open Cubes by Sol Lewitt (below left, 1974) and Arc Forms by Christopher Carlson (below right, 2009) illustrate this. Open Cubes shows possible forms of a cube with one or more missing edges. Arc Forms shows all possible combinations of semicircles joined at 3 connection points evenly distributed along a vertical line. You can choose to design a visual structure for which it is practical to enumerate all possible combinations — or you may design one for which it isn’t.
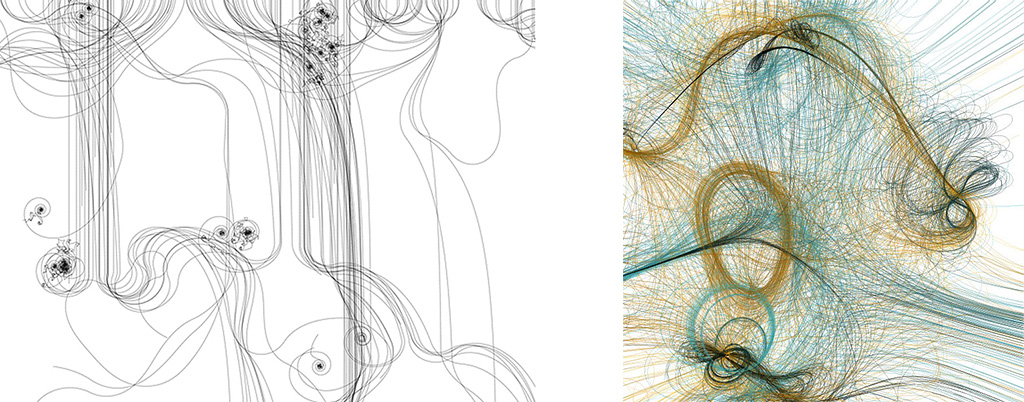
Premise IV. (Or) In his Pedagogical Sketchbook (1925), Paul Klee states that a line is a “dot that went for a walk”. Here, develop a composition in which the plotter goes for an interesting walk, or collection of walks.
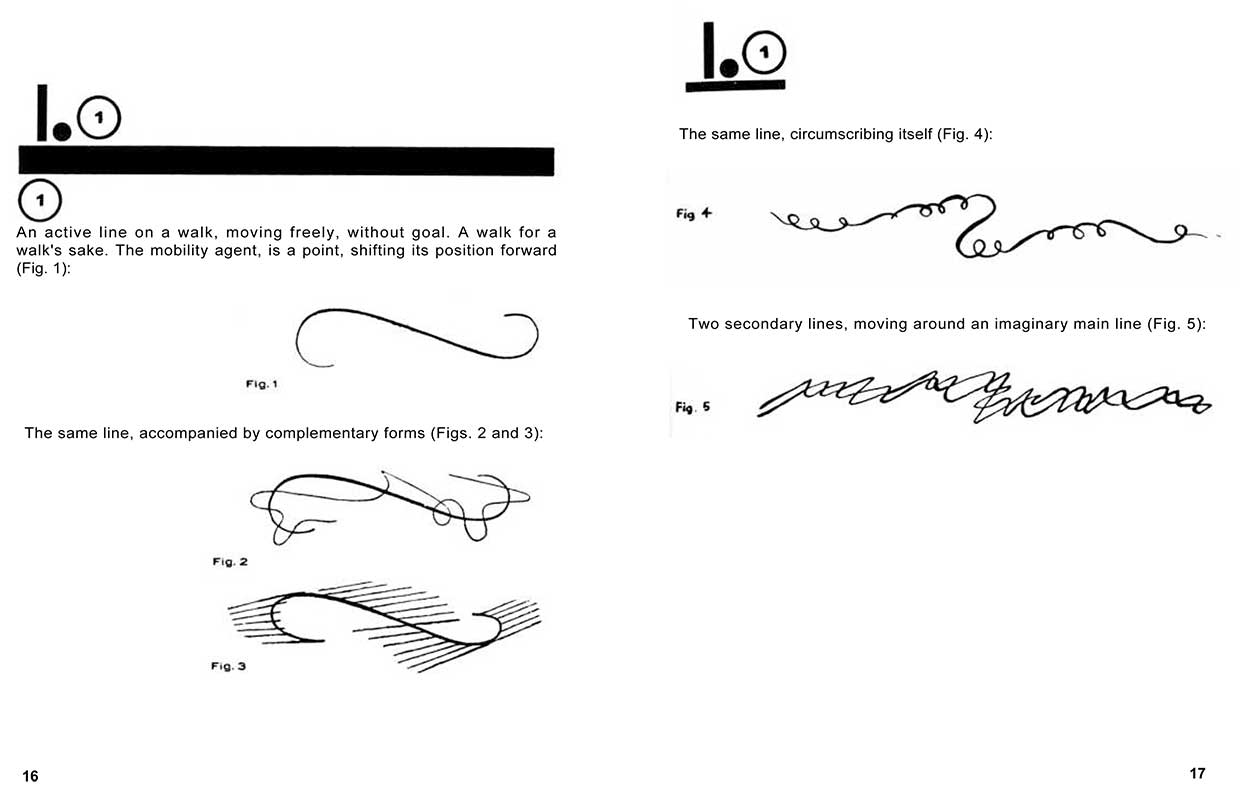
The artwork Sum05 by Austrian software artist (2005), Lia (at left) and the artwork Path_P by Casey Reas (2001), are examples of this.
Premise V. (Or) A tool for recording/displaying a real-time signal, in which you engage the plotter as a dynamic robot, in order to develop a drawing whose details are not known in advance. Your drawing might be based on real-time data from Twitter, weather data, Leap controller, mouse gestural data, etc., or random data which is computed during the course of the plotting. An example of this premise is the project Drawing with Heart (2016), by CMU MTID student, Robert Zacharias, who uses the plotter to render his pulse in real-time using an Arduino and a simple, low-cost pulse oximeter:

Premise VI. (Or) Create a custom pixel. Using lines, develop a halftone scheme to represent a photograph. The plotter artwork Studies in Perception #1, by Kenneth Knowlton and Leon Harmon (1966), is an example of this; it uses a series of symbols to represent different grayscale values.
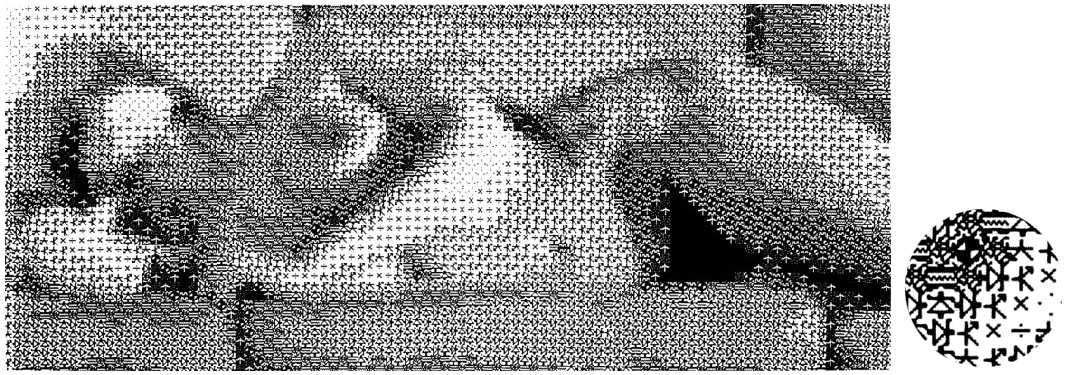
Another example is the TSP art genre, as in works made by Craig Kaplan, which renders an image with a single line. This line connects a series of points, using a solution to the “Traveling Salesman Problem”, where the points are placed probabilistically according to the darkness of the underlying image:
For more inspiration and ideas, you’re encouraged to check out the #plotterTwittter hashtag on Twitter, where artists have been posting their results. For example, see this nice grid of imperfect circles.
Recommended Process, Considerations, Requirements
We have an Evil Mad Scientist Axidraw and an MH871 available. You have a fundamental technical decision to make; there are basically two different ways you can control a plotter:
- Most conventionally, you “control” the plotter with a data file (such as a PDF containing vector line data) that you have computed in advance. In this case, you will write a program that generates such a file. Then, you “print” the image in a way similar to printing with a conventional printer (sort-of).
- Alternatively, you can control the plotter as a real-time robot, controlled by real-time data (e.g. mouse gestures, weather data, random noise, etc.). In this case, you will write a program that sends commands to the plotter. Caution: Timing becomes a very important consideration. This is a more advanced scenario.
Furthermore:
- Keep in mind that your basic graphic primitive is the line. If you want to make a filled shape, you’ll have to do that with… lines. This may require that you design a halftone scheme of some kind.
- Our MH871 plotter has a cutter attachment, which can allow you to cut shapes out of flat materials. That’s fine.
- If you have access to a laser cutter, etc., feel free to use it if you wish. I’m not able to provide technical support for that kind of experiment, however.
Here’s a recommended process:
- Sketch first. Do some drawings in your sketchbook.
- Write code to generate the PDF output or other design. You’ll probably work in Processing.
- Make an appointment! Please come in to the STUDIO (make an appointment with Golan and/or Dan Moore) for assistance with plotting. Be aware that it may take a couple tries. Don’t try to arrange a plotting session if you know you’ll have to leave in 30 minutes. Plotting takes time, peoples.
- Plot it! Execute your work on the plotter. Give consideration to materials: the color, texture, and tooth of your paper; the bleed of your pen, or the bristles of your brush. Bring extra materials, since printing is a mechanical process, and it may take more than one attempt to produce a successful print.
- Blog it. Create a blog post. Give your post the title, nickname-Plot, and give it the wordpress Category, Plot.
- Document it. Scan your sketches; take a screenshot from your Processing program; photograph the plotter while it’s making your plot; photograph your plot. Create a video (or animated GIF) of your plot being made. Embed these into your blog post.
- Write about it. Please write a paragraph (100-150 words) about your process, with an evaluation of your results. What’s different about using a plotter device than a screen?
Controlling the Axidraw in Real-Time
For instructions on controlling the Axidraw in real-time, use Aaron Koblin’s code and directions.
Generating a PDF in Processing
Processing can generate high-resolution vector output in the popular PDF format. To do this, we strongly recommend you consult this terrific set of instructions here. That webpage includes instructions on how to generate PDF files in many different ways, including: generating 2D art from 3D geometry, generating PDFs from multiple frames’ worth of graphics, etc.
Here’s a very simple Processing template which I’ve made for you, adapted from the above, which has most of what you’ll probably need:
// see https://processing.org/reference/libraries/pdf/index.html
import processing.pdf.*;
boolean bRecordingPDF;
int pdfOutputCount = 0;
void setup() {
size(500, 500);
bRecordingPDF = true;
}
void keyPressed() {
// When you press a key, it will initiate a PDF export
bRecordingPDF = true;
}
void draw() {
if (bRecordingPDF) {
background(255); // this should come BEFORE beginRecord()
beginRecord(PDF, "myName_" + pdfOutputCount + ".pdf");
//--------------------------
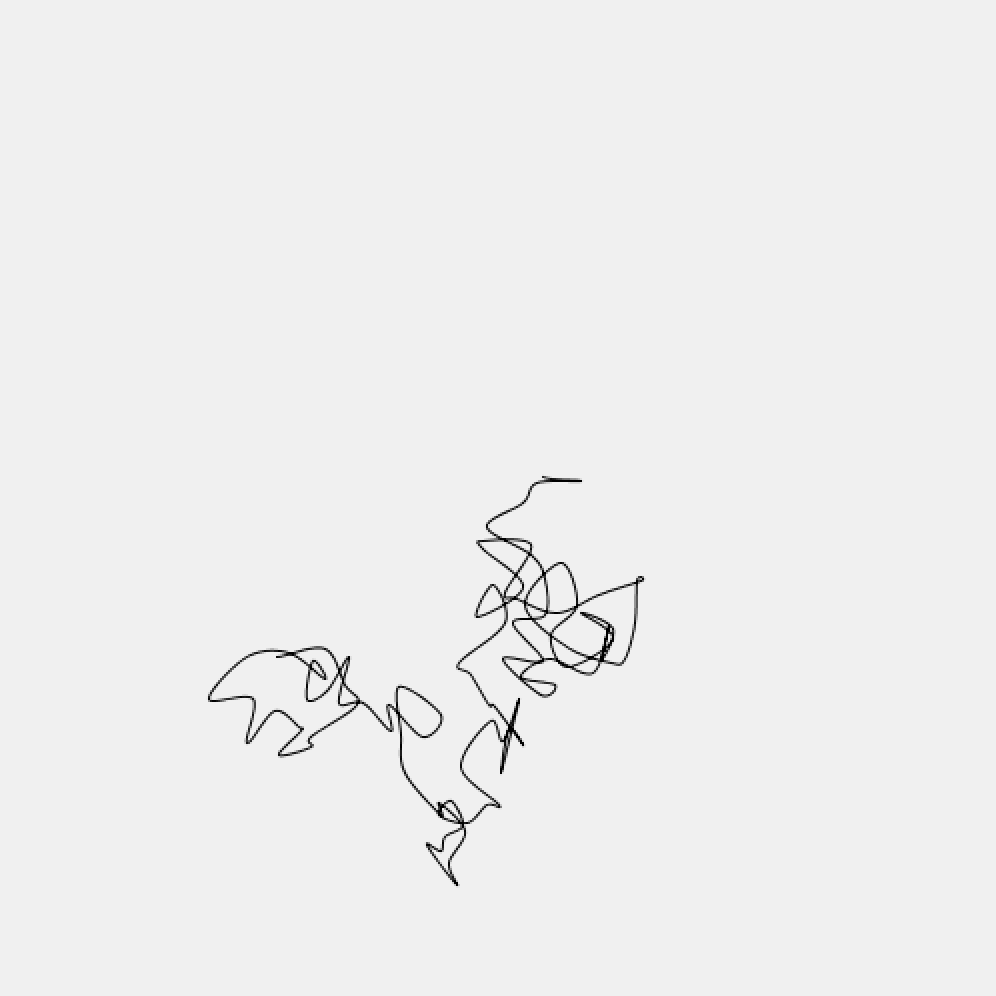
// This draws a squiggly drunk walk.
noFill();
beginShape();
float rx = width/2;
float ry = height/2;
for (int i=0; i < 100; i++) {
rx = rx + random(-25, 25);
ry = ry + random(-25, 25);
curveVertex(rx, ry);
}
endShape();
//--------------------------
endRecord();
bRecordingPDF = false;
pdfOutputCount++;
}
}
This drawing produces a random walk using a curve.
Here are some things to note about this program:
- This system outputs a PDF whenever you press a key.
- You can render your artwork with line, ellipse, rect, beginShape/vertex/endShape, and any other commands that create stroked lines.
- In my template program, the filenames of multiple PDFs are numbered consecutively. The PDFs are exported into your sketch folder; you can find these PDFs with Command-K, “Show sketch folder”.
- I strongly recommend that you place the
background()command before you request the system tobeginRecord()the PDF. Otherwise, the system will add a big rectangle to your output, which is inconvenient. Did you read this?
Instructions and code for rendering a PDF with the Axidraw from Inkscape will be posted here shortly.