Spoon-Intersections

Intersections with 12 lines.


Intersections with 100 lines


1
2
3
4
5
6
7
8
9
10
11
12
13
14
15
16
17
18
19
20
21
22
23
24
25
26
27
28
29
30
31
32
33
34
35
36
37
38
39
40
41
42
43
44
45
46
47
48
49
50
51
52
53
54
55
56
57
58
59
60
61
62
63
64
65
66
67
 var boolDoRefresh;
 const NUM_LINES = 12;
 
 function setup() {
   createCanvas(720, 480);
   background('#FFFFFF');
   strokeWeight(5);
   boolDoRefresh = true;
 }
 
 function draw() {
   if(boolDoRefresh) {
     background('#FFFFFF');
     var lines = constructLines();
     findIntersections(lines);
     boolDoRefresh = false;
   }
 }
 
 function mousePressed() {
    boolDoRefresh = true;
 }
 
 function constructLines() {
   const LINE_LENGTH = 250;
   var lines = [];
   for(var i = 0; i < NUM_LINES; i++) {
     var x1 = random(720);
     var y1 = random(480);
     var x2 = random(100) > 50 ? x1 - random(LINE_LENGTH) : x1 + random(LINE_LENGTH);
     var y2 = ((random(100) > 50 ? 1 : -1) * sqrt(sq(LINE_LENGTH) - sq(x1 - x2))) + y1;
 
     line(x1, y1, x2, y2);
     lines[i] = [x1, y1, x2, y2];
   }
   return lines;
 }
 
 function findIntersections(lines) {
   //uses calculations found at http://paulbourke.net/geometry/pointlineplane/
   //draws circles around any points where lines intersect
   for(var i = 0; i < NUM_LINES; i++) {
     for(var j = i + 1; j < NUM_LINES; j++) {
       var x1 = lines[i][0];
       var x2 = lines[i][2];
       var y1 = lines[i][1];
       var y2 = lines[i][3];
 
       var x3 = lines[j][0];
       var x4 = lines[j][2];
       var y3 = lines[j][1];
       var y4 = lines[j][3];
 
       var u1 = (((x4 - x3) * (y1 - y3)) - ((y4 - y3) * (x1 - x3)))
            / (((y4 - y3) * (x2 - x1)) - ((x4 - x3) * (y2 - y1)));
       var u2 = (((x2 - x1) * (y1 - y3)) - ((y2 - y1) * (x1 - x3)))
            / (((y4 - y3) * (x2 - x1)) - ((x4 - x3) * (y2 - y1)));
 
       if(u1 > 0 && u1 < 1 && u2 > 0 && u2 < 1) {
         var x = x1 + (u1 * (x2 - x1));
         var y = y1 + (u1 * (y2 - y1));
         fill('#FFC600');
         ellipse(x, y, 15);
       }
     }
   }
 }

rigatoni – Interruptions01

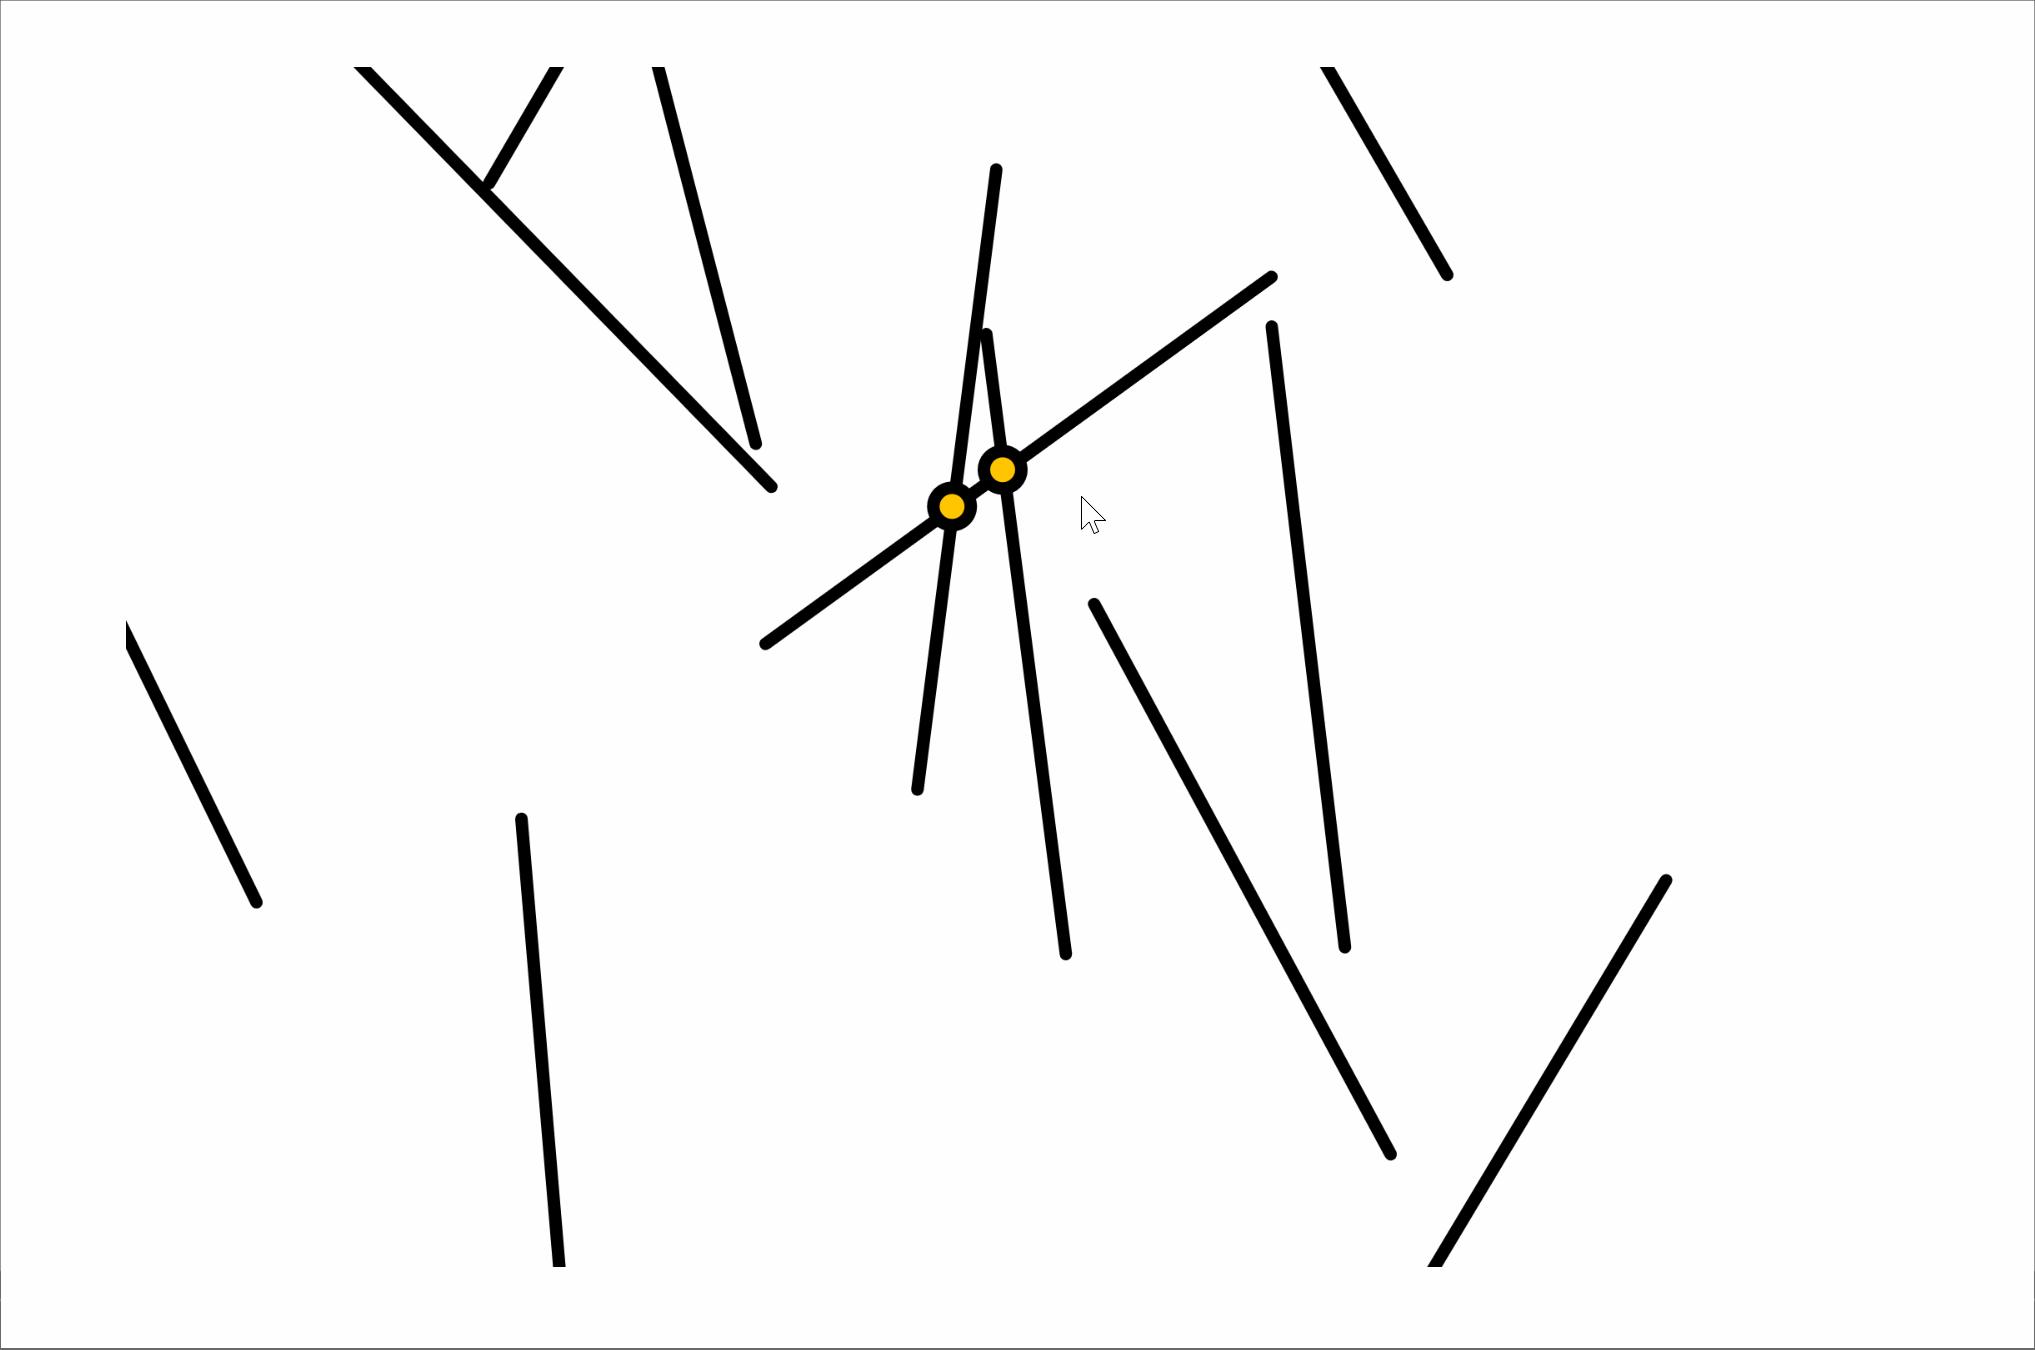
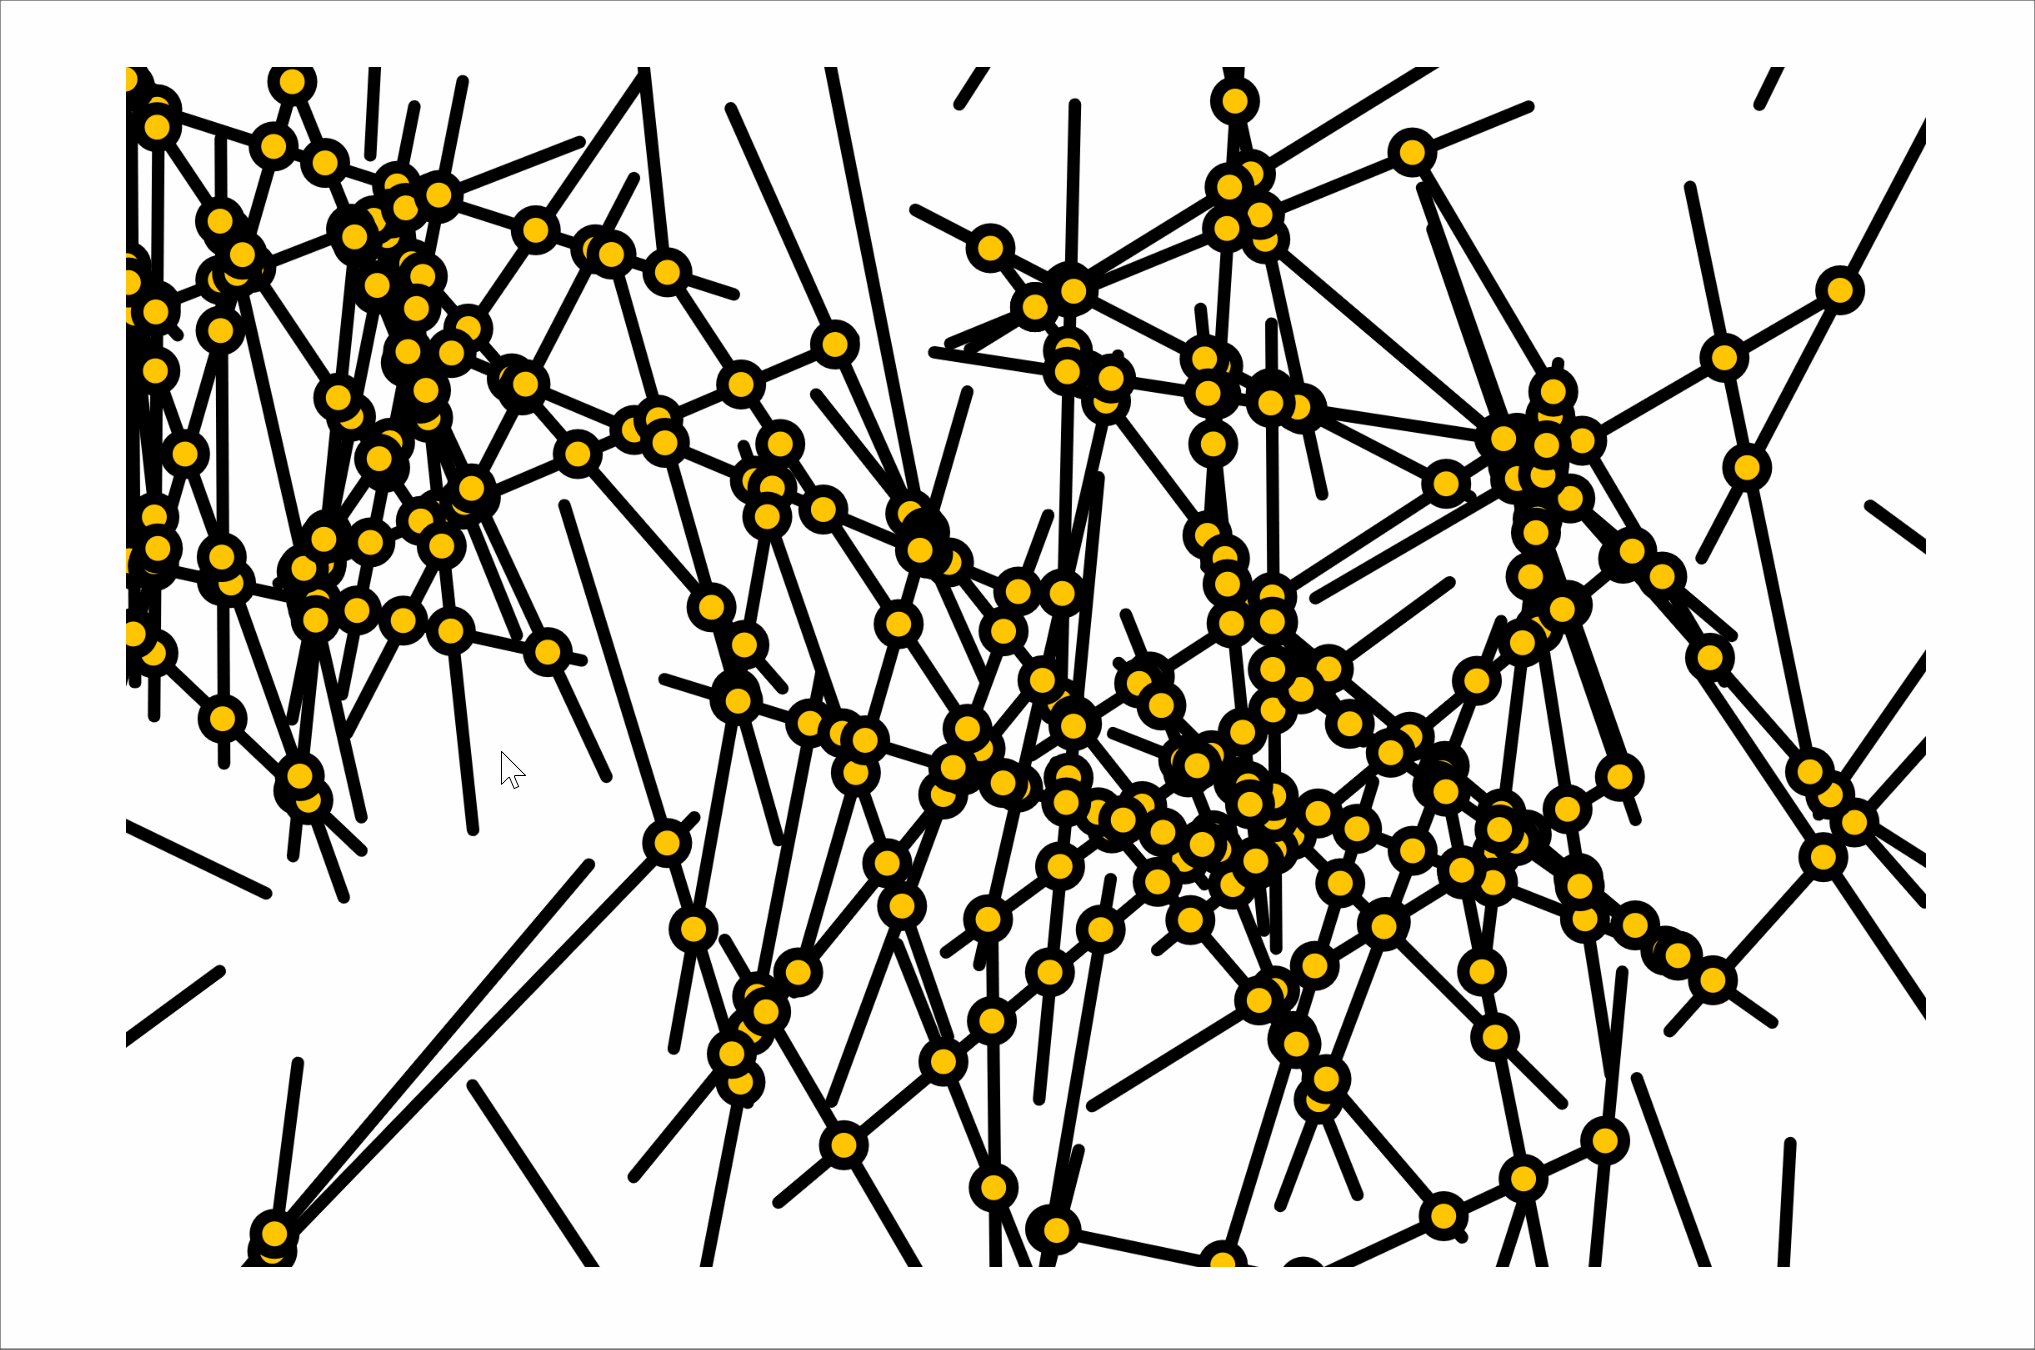
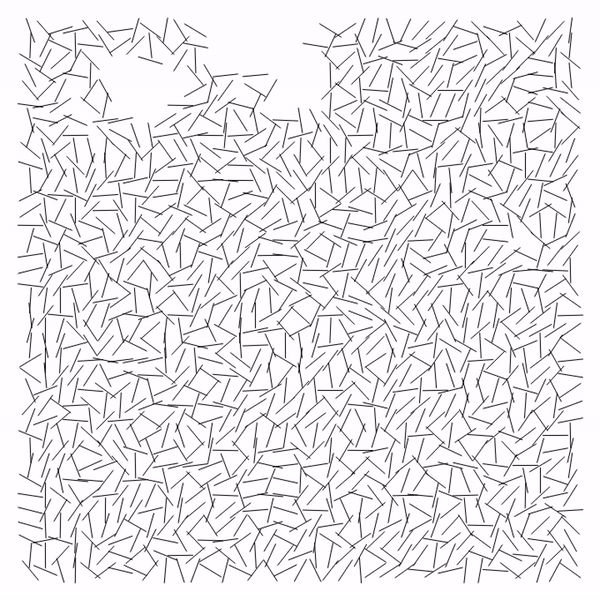
Since working on this project, I was left feeling hugely unsatisfied with the quality of my work. The morning session on Friday (7/9) helped me understand what this assignment was really about, make some fundamental observations about Vera's work and learn what Perlin noise was. Here is my second attempt at interruptions. My original attempt is still available towards the end of this post. Without further ado, Interruptions - The Sequel!

var interval
var lineSize
let redraw = true
function setup() {
  createCanvas(720, 720);
	//The grid in Vera's version was roughly 55x55
	interval = width/55
	lineSize = interval * .9
}
 
function draw() {
  if(redraw) {
  	background(200);
    GenerateLines()
    redraw=false
  }
}
 
function mouseClicked() {
	redraw = true 
}
 
// Helper Methods
function GenerateLines() {
  strokeWeight(1.5)
  noiseDetail(6, .65)
  noiseSeed(random(0, 1000))
  var noiseVal = -1
	for(var x=2*interval; x<width-2*interval; x+=interval) {
		for(var y=2*interval; y<width-2*interval; y+=interval) {
      noiseVal = noise(x/150,y/150)
      var midPoint = new Point(x,y)
      var startPoint = getRandomPointOnCircumference(midPoint, lineSize)
      //print(startPoint)
      var endPoint = getColinearEndPoint(startPoint, midPoint)
			var segment = new Segment(startPoint, endPoint)
      fill(noiseVal*255)
      // Uncomment this to see the noise values being generated per grid cell
      //rect(x,y,x+lineSize,y+lineSize)
      if(noiseVal>=.5) {
        segment.Draw() 
      }
    }
	}
}
 
function getRandomPointOnCircumference(center, radius) {
	var theta = random(0, TWO_PI)
  var x = sin(theta)*radius + center.x
  var y = cos(theta)*radius + center.y
  return new Point(x, y)
}
 
function getColinearEndPoint(startPoint, midPoint) {
	var endPoint = midPoint.Copy()
  var directionVector = midPoint.Copy()
  directionVector.Subtract(startPoint)
  endPoint.Add(directionVector)
  return endPoint
}
 
 
// Classes
function Point(x, y) {
  this.x = x
  this.y = y
  this.Add = function(addend) {
  	this.x += addend.x
    this.y += addend.y
  }
  this.Subtract = function(addend) {
		this.x -= addend.x
    this.y -= addend.y
  }
  this.Copy = function() {
		return new Point(this.x, this.y) 
  }
}
 
function Segment(startPoint, endPoint) {
	this.startPoint = startPoint
  this.endPoint = endPoint
  this.Draw = function() {
		line(startPoint.x, startPoint.y, endPoint.x, endPoint.y) 
  }
}
 
function LineGrid() {
	this.lines = []
  this.count = 0
  this.AddLine = function(_line) {
		this.lines.push(_line)
  }
  this.RemoveLine = function(_line) {
  	this.lines.pop(_line)
  }
}

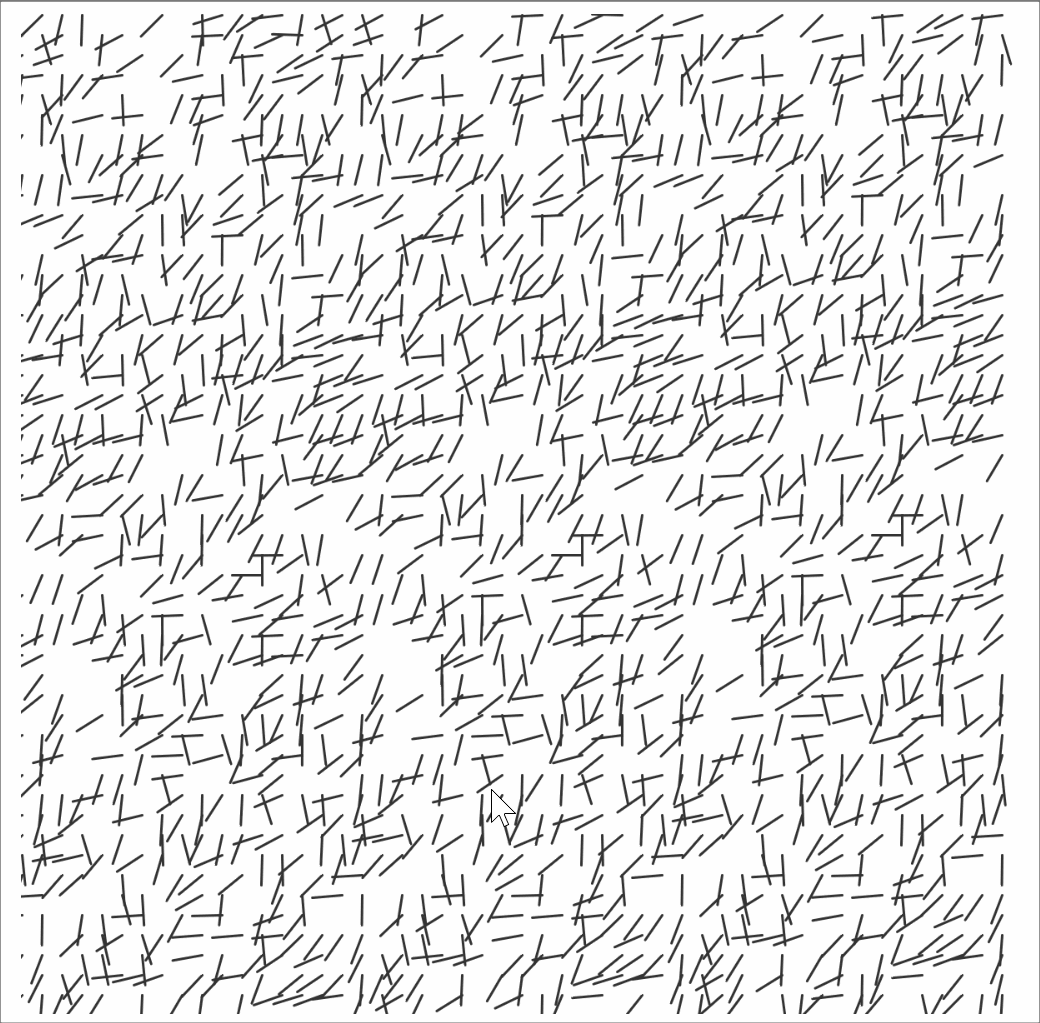
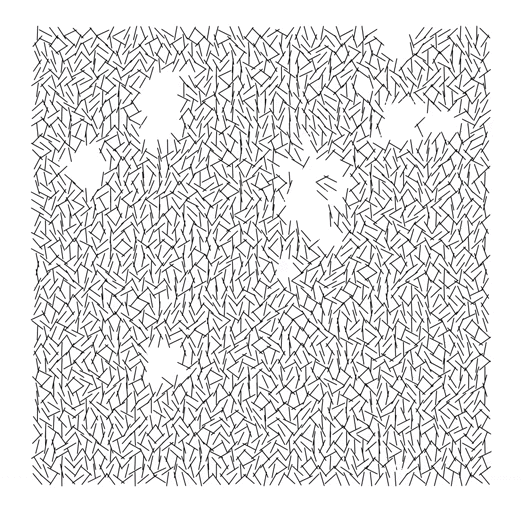
Below you will find my original attempt at Interruptions.

via GIPHY

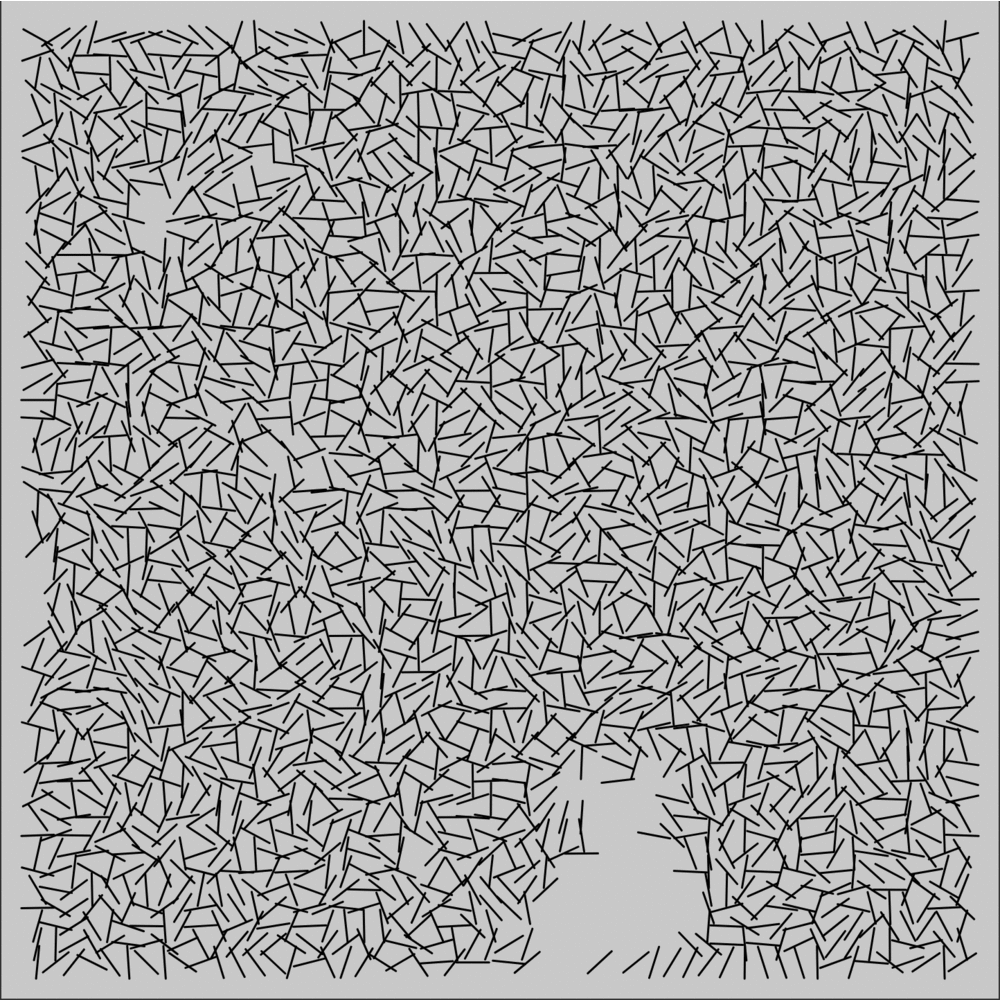
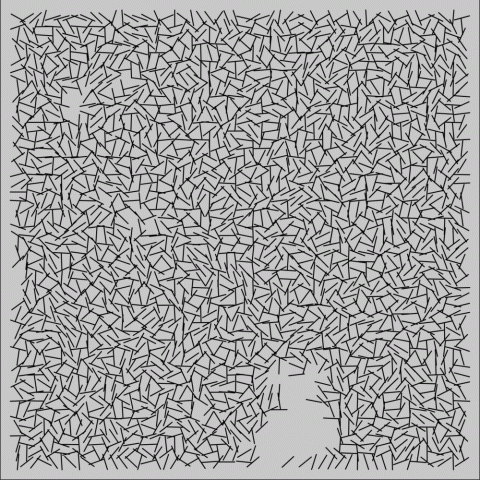
INITIAL OBSERVATIONS
(1) The lines are all roughly the same length
(2) There's patches where the lines don't appear
(3) The intersections of lines occur roughly towards the ends of the lines
(4) There's no real clumping/pattern; it seems random (as opposed to Perlin?)
(5) There are multiple hundreds of lines here
(6) There is no variance in thickness or transparency
(7) The compositions are all square
(8) Although there are gaps, the work is still densely populated
(9) Contrary to the gaps, there aren't areas that are MORE dense; only less
(10) The background isn't a full white, and that's less harsh on the eyes

Of course I realize now that (4) was flawed and I ended up needing Perlin noise after all. I barely scratched the surface though, and I think that would have been key to getting the look right. I wish I had given myself more time to actually figure out how noise works, as right now I am missing the gaps in the lines and the intersections aren't like what I observed in (3). After I was finished I checked out some of the other
attempts at replicating Interruptions and I was blown away by how much detail and level of control was achieved in some of them. I noticed other
people were making a conscientious effort to preserve the "randomness" and I plan to figure out how that is done next.

let redraw = true
function setup() {
  createCanvas(720, 720);
}
 
function draw() {
  if(redraw) {
    background(150);
    for(var i=0; i<3000; i++) {
      noiseSeed()
      var x1 = random(50, width-50)
    	var y1 = random(50, height-50)
      var x2 = (noise(x1)-.5)*200+x1
      var y2 = (noise(y1)-.5)*200+y1
      if(x2>50 && x2<width-50 && y2>50 && y2<height-50) {
      	line(x1, y1, x2, y2)
      }
    }
    redraw=false
  }
}
 
function mouseClicked() {
	redraw = true 
}

ocannoli-Interruptions.

  • The work is square
  • The work consists of various black lines on a white background
  • The lines are the same length
  • Many of the lines are at an angle
  • White spaces that lack black lines seem to occur to varying degrees
  • The lines are thin
  • The lines often touch one another to make diamond, square, and triangle shapesMany of the lines touch each other but not all
  • The lines seem random but also feel somewhat repetitive
  • The lines have a type of pattern involving either intersections, distance or the like

First I started with basic appearance based characteristics like the length of lines and colors. Then after some trial and error of creating random methods with the random function, I ended up creating a 50X50 grid of all lines then trying to accomplish their rotation. To figure out the rotation I ended up using perlin noise as the basis for that method. After tweaking some scaling, I attempted to add random spaces between the lines by skipping the creation of a line if the noise was in a certain small range. Although I did not complete it, at the end I was working on a method that would make sure all lines only intersected another line at its end point.

sapeck-Interruptions

Observations:

    • The lines are black.
    • The lines are all of the same weight.
    • The background is white.
    • The lines appear to be arranged in relation to some sort of grid.
    • Most of the lines have angles close to 90° or 180°, but fewer of the lines have slopes that appear to be around 45°.
    • The lines are all of the same length.
    • The lines appear to be arranged in columns and rows with the same midpoint.
    • The blank spaces are created by the rotation of the line segments.
    • There are no missing line segments at each point of line midpoint on the grid except in large blobs.
    • There are lines missing in certain areas.

I created my "re-code" of Molnár's project by creating a grid of line segments rotated at random angles. To recreate the similarity between many of the lines (most are nearly vertical), I started with Perlin noise and added a random rotation deviation. I created gaps with a Perlin noise threshold. To randomize the gaps, I add a random value to the Perlin noise coordinates to act as a randomness "seed." My original solution was to subtract standard geometric shapes to create the spaces, but this did not yield the same "random blob" affect that Molnár achieved. I am impressed with how she created the empty swaths, as her work predates the publication of Perlin noise. She was also working with punch cards, an analog plotter, and very early, slow computers.

/* Sapeck    9/6/2017
"sapeck-Interruptions"
60-212                        Carnegie Mellon University
Copyright (C) 2018-present  Sapeck
This program is free software: you can redistribute it and/or modify it under the terms of the GNU General Public License version 3 as published by the Free Software Foundation.
This program is distributed in the hope that it will be useful, but WITHOUT ANY WARRANTY; without even the implied warranty of MERCHANTABILITY or FITNESS FOR A PARTICULAR PURPOSE. See the GNU General Public License for more details.
*/
 
var SPACING_X = 18
var SPACING_Y = 18
var LENGTH = 30
var NOISE_THRESHOLD = 0.26
 
// Based on starter Code for "Embedded Iteration + Randomness"
 
var LENGTH_HALF = LENGTH/2
var boolDoRefresh;
 
function setup() {
  createCanvas(720, 720)
  boolDoRefresh = true
}
 
function draw() {
  if (boolDoRefresh) {
    background(255);
		var NOISEX_SEED = random(0, 20000)
		var NOISEY_SEED = random(0, 20000)
 
    let MAX_ROWS = (height-2*SPACING_Y) / SPACING_Y
    let MAX_COLS = (width-2*SPACING_X) / SPACING_X
 
    for (let col=1;col<MAX_COLS;col++) {
      for (let row=1;row<MAX_ROWS;row++) {
        m = noise(col/10, row/10)
        m += random(-2, 2)
 
        let x1 = col*SPACING_X + SPACING_X
        let y1 = row*SPACING_Y + SPACING_Y
 
        let g = noise(col/10+NOISEX_SEED, row/10+NOISEY_SEED)
 
        if (g > NOISE_THRESHOLD) {
          let x2 = x1 + LENGTH_HALF*cos(m)
          let y2 = y1 + LENGTH_HALF*sin(m)
          let x3 = x1 - LENGTH_HALF*cos(m)
          let y3 = y1 - LENGTH_HALF*sin(m)
          line(x1, y1, x2, y2)
          line(x1, y1, x3, y3)
        }
      }
    }
 
  	boolDoRefresh = false
  }
}
 
function mousePressed() {
  boolDoRefresh = true
}

yalbert-Interruptions

This project was an interesting challenge because it forced me to evaluate the correctness of my work in an analogue as opposed to digital manner. By this I mean that I was not evaluating whether my project worked or not in absolute terms. Instead, I was observing its correctness in a fluid manner. There were many instances where I looked at it and thought, this almost seems right, but it isn't quite there yet. This is a workflow that I'm accustomed to in design classes but feels foreign in the context of a computationally based course. That being said, I really enjoyed working on this. In particular, computing line visibility on a grid taught me a new thing about Perlin noise. I've been using it for a few years but didn't fully understand how it worked until this project, which was really exciting.

var segs = [];
var margin = 20;
var segLength = 20;
var numSegs = 1500;
var clicked = false;
var segsSpacing = 13;
var xVisOff = 0.0;
var yVisOff = 0.0;
 
function setup() {
  angleMode(DEGREES);
  createCanvas(555, 555);
  resetSegs();
}
 
function draw() {
  background(255);
  if(clicked){
    clicked = false;
    resetSegs();
  }
  drawSegs();
}
 
function resetSegs(){
  segs = [];
  for(i = 0; i < sqrt(numSegs); i++){
    xVisOff = xVisOff + 0.2;
    yVisOff = 0.0
    for(j = 0; j < sqrt(numSegs); j++){
      yVisOff = yVisOff + 0.2;
      var x1 = i*segsSpacing + margin*1.5;
      var y1 = j*segsSpacing + margin;
      var secondPoint = setSecondPoint(x1, y1);
      var x2 = secondPoint[0];
      var y2 = secondPoint[1];  
      newSeg = new Segment(x1, x2, y1, y2, setVisibility());
      segs.push(newSeg);
    }
  }
}
 
//uses perlin noise to determine whether the line is visible or not
function setVisibility(){
  var opValue = noise(xVisOff, yVisOff);
  if(opValue > .3){
    return true;
  }else{
    return false;
  }
}
 
function drawSegs(){
  for(i = 0; i < numSegs; i++){
    segs[i].drawSeg();
  }
}
 
 
function mousePressed() {
  clicked = true;
}
 
function Segment(x1, x2, y1, y2, visibility){
  this.x1 = x1;
  this.x2 = x2;
  this.y1 = y1;
  this.y2 = y2;
  this.drawSeg = function(){
    stroke(0);
    strokeWeight(1);
    if(this.isVisible){
      line(this.x1, this.y1, this.x2, this.y2);      
    }
  }
  this.isVisible = visibility;
}
 
//Calculates the second point by selecting a point at the edge of a circle
//where the radius is the desired length of the lines and the center
//is the first point
function setSecondPoint(x1, y1){
  var angle = random(50, 150);
  var y2 = sin(angle) * segLength + y1;
  var x2 = cos(angle) * segLength + x1; 
  return [x2, y2];
}

nerual-Intersections

var boolDoRefresh;
var lineArr;
var bkgrd = 255;
var canvasW = 600;
var canvasH = 600;
var numLines = 12;
 
function setup() {
  createCanvas(canvasW, canvasH);
  boolDoRefresh = true;
  background(bkgrd);
  lineArr = [];
  //noFill();
}
 
function draw() {
  var x1,x2,x3,x4,y1,y2,y3,y4;
  if (boolDoRefresh) {
    for (var i = 0; i < numLines; i++) {
      createLine();
    }
    
    for (i = 0; i+1 < numLines; i++){
      for (j = i+1; j < numLines; j++){
        var a = lineArr[i];
        var b = lineArr[j];
        drawIntersect(a,b);
      } 
    }
    
    boolDoRefresh = false;
  }
}

function createLine() {
  x1 = random(canvasW);
  y1 = random(canvasH);
  x2 = random(canvasW);
  y2 = random(canvasH);
  stroke(0);
  line(x1,y1,x2,y2);
  lineArr.push([x1,y1,x2,y2]);
}

function drawIntersect(a, b){
  x1 = a[0]; y1 = a[1]; x2 = a[2]; y2 = a[3];
  x3 = b[0]; y3 = b[1]; x4 = b[2]; y4 = b[3];

  var denom = (y4-y3)*(x2-x1) - (x4-x3)*(y2-y1);
  if (denom == 0) {
    return;
  }
  
  var ua = ((x4-x3)*(y1-y3) - (y4-y3)*(x1-x3))/denom;
  var ub = ((x2-x1)*(y1-y3) - (y2-y1)*(x1-x3))/denom;
      
  var ix = x1 + ua*(x2-x1);
  var iy = y1 + ua*(y2-y1);
        
  if (ua < 0 || ua > 1 || ub < 0 || ub > 1) {
    return;
  }
  noStroke();
  fill(random(256),random(256),random(256),150);
  ellipse(ix, iy, 20, 20);
  fill(255,255,255,200);
  ellipse(ix,iy,5,5);
  resetProps();
}

function resetProps(){
  stroke(0);
}
 
function mousePressed() {
  lineArr = [];
  background(bkgrd);
  boolDoRefresh = true;
}

neural-Interruptions

Observations:
  1. The artwork is square.
  2. There is a border of white along the edges.
  3. The lines all tend to have a bias toward vertical or horizontal in each piece, from a further away view.
  4. Very few individual lines are rotated anywhere near horizontal(for the vertically oriented pieces).
  5. Open areas between lines seem to have fairly uniform, if random shapes.
  6. The lines look like they line up in a grid, with each line rotated about its midpoint.
  7. The lines are all short and have the same length
  8. The lines are black. The background is white.
  9. The larger open spaces have irregular shapes and are fairly sparse.
  10. Some of the large open spaces occur at the 'edges' and there are no lines in that part of the edge.
  11. There are lots of small parallelograms, triangles, and sometimes pentagons formed by adjacent lines.
  12. There are at least fifty lines in a row/column.

var boolDoRefresh;
var boolDoRefresh;
var bkgrd = 255;
var canvasW = 650;
var canvasH = 650;
var border = 30;
var gridSize = 56;
var baseAngle = 90; //change to 0 for horizontal orientation
var lineRadius = 9;
 
function setup() {
  createCanvas(canvasW, canvasH);
  boolDoRefresh = true;
  background(bkgrd);
  noFill();
  angleMode(DEGREES);
}
 
function draw() {
  if (boolDoRefresh) {
    drawTheThing();
    boolDoRefresh = false;
  }
}
 
function drawTheThing(){
  var div = (width - 2*border)/gridSize;
  var noiseVal;
  var noiseScale=0.01;
    for (var x = border; x &lt; width - border; x += div){
      for (var y = border; y &lt; width - border; y += div){ 
        noiseDetail(3,0.7); 
        noiseVal = noise((x) * noiseScale, (y) * noiseScale); 
        if(noiseVal &gt; 0.75) stroke(255);
        else stroke(0);
        drawLineCenteredAt(x,y);
      }
    }
}
 
function drawLineCenteredAt(x,y){
  var angle, dx, dy, bias;
  bias = 65;
  angle = baseAngle - random(bias);
  var half = random(2);
  var neg;
  if (half &lt; 1) neg = -1;
  else neg = 1;
  dx = neg*lineRadius*cos(angle);
  dy = lineRadius*sin(angle);
  line(x+dx,y+dy, x-dx,y-dy);
}
 
function mousePressed() {
  noiseSeed(random(100));
  background(bkgrd);
  boolDoRefresh = true;
}
Some Thoughts

I started with the general form, a grid of randomly rotated lines, then added in noise, then fine-tuned the lines' randomness. The vertical/horizontal bias was interesting. The angle rotated definitely had to be less than 90 degrees, but I wasn't sure if the angle deviation was constant or formed a kind of bell curve around a point(ultimately it made little difference).  The noise was also difficult because understanding what the different settings meant didn't translate to imagining what the overall effect would be, so it was a lot of testing and close comparison. I learned to appreciate examining an art piece in extremely great detail and seeing what kind of fiddling went into achieving that specific impression. I think I made a good copy at a glance, although I think the noise could have been less harsh.

nannon-Interruptions

// Starter Code for "Embedded Iteration + Randomness"
var boolDoRefresh;
 
function setup() {
  createCanvas(744, 744);
  background(255,255,255)
  boolDoRefresh = true;
 
}
function findpointcircle(i,j) {
 
    var margin=48
    var square=12
    var r = 8
    // console.log(i,j)
    var midx=margin+((j*square)-(0.5*square))
    var midy=margin+((i*square)-(0.5*square))
 
    var slope = map(i*j, 0,25,0,10)
 
    var deg = randomGaussian(2*PI, 0.7);
 
    var x = midx+(r*sin(deg))
    var y= midy+(r*cos(deg))
    //(x – h)2 + (y – k)2 = r2
    var endx = midx+(r*sin(deg+PI))
    var endy = midy+(r*cos(deg+PI))
    return [x, y, endx, endy]
}
 
 
function draw() {
  if (boolDoRefresh) {
    setup()
    noiseSeed();
    var size=56
    for (i=0; i&lt;size;i++) {
        for (j=0; j&lt;size;j++) { // noiseDetail(5,0.5); var blank = noise(i*0.1+10,j*0.1) var blank2 = noise(i*3+10,j*0.1) // console.log(i*0.02+10, j*0.02, blank) strokeWeight(1); var points =findpointcircle(i,j) if (blank&gt;0.32) {
								line(points[0], points[1], points[2], points[3])
						}
          	else if (blank&lt;=0.25 &amp;&amp;blank2&lt;=0.5) {
              	line(points[0], points[1], points[2], points[3])
            }
        }
    }
    boolDoRefresh = false;
  }
}
 
function mousePressed() {
  boolDoRefresh = true;
}

Observations:
1. The artwork is square.
2. The artwork consists of many short black lines, on a white background.
3. The lines all have the same length
4. It is 56 x 56 lines (I think)
5. The lines have varying random degrees of rotation
6. There is like 3-5% chance of no line drawn
7. The lines don't take up their own space, there is a lot of overlap
8. some of the artworks are "mostly vertical" lines and some are "mostly horizontal" lines
9. There are random blobs of blankness
10. There is a small gradation towards blankness

Reflection:

Gaussian distribution and perlin noise have been words I've been hearing around for a long time now, but have never understood. What was especially hard about this was getting the blanks in the Vera drawings correct. At the end, I still feel like my blanks are shaped a bit too round...to be honest, I still don't really understand how the noise distributions are made. I spent a lot of time inserting random numbers as my "noise scale." I understand the general concept of noise, but will need to technically understand it more. Edit: After posting this, I actually realized that I had forgotten to make sure that the mean angle of the lines changes--every time, the lines in my piece are mostly vertical. However it was satisfying to see how Gaussian distributions are utilized.

chewie-Interruptions

Observations:

  1. The artwork is in the shape of a square
  2. The artwork has a white background featuring many black lines.
  3. The center of each line seems to fall on the coordinates of a 56x56 unit grid
  4. The length of each line is equal to the lines spacing on the grid so that some of the lines intersect.
  5. Each line is set at a random angle. The angle of each line seems independent from the angles of the lines around it.
  6. Some spaces on the grid that you would expect to see a line are missing a line.
  7. The lines' angles seem to tend toward vertical.
  8. Theres an empty border around the lines.
  9. The randomness of the rotation of the lines seems independent from where lines are missing.
  10. The missing lines seem to be related to each other; there are "areas" on the grid where lines are missing or appear to be blown away.
  11. Even in places where there isn't a large area of lines missing, there are a few lines missing here and there.

The most challenging part about this piece was having to figure out the logic behind what seems like a chaotic image. While it looks very busy, the most defining features of this piece for me where the grid layout of the lines, the vertical-tending angled lines, and the large spaces where lines were missing. The large spaces of empty lines was the most difficult aspect to reproduce, followed by the angles of the lines. I chose to generate probability coefficients for each line using the noise() function. Because the noise() function used the row/column of each line, there were specific areas where lines were much  less likely to occur. T0 randomize the angle of the lines I first generated a random x-coordinate within the line's cell and made the end fall on that coordinate. This way there would be a higher probability of the line tending vertical. I enjoyed recreating this piece because it made me think about how to distinguish patterns and key characteristics of a seemingly random system. Having to break down the each element into basic properties to recreate was a fun exercise .


lass-Interruptions

Observations:

1. The artwork is square
2. The artwork is made of many short black lines of the same length
3. There are areas of the artwork where the lines are missing
4. The lines are angled randomly
5. The lines are distributed evenly
6. There are clusters of missing lines
7. Although the lines are angled randomly, they seem to tend towards vertical(at least in the first 3 images)
8. The lines can be sorted into a square grid, where the height of each row is shorter than the length of a black line
9. The lines overlap in places
10. Some columns seem to have more vertical-tending lines than others

One of the things I was stumped on with this project was how to create the clusters of missing lines (#6). Golan and Char helped me by telling me to look into perlin noise. At first, using perlin noise seemed no different from using randomness to determine if a line should be missing or not, but by looking at pictures of perlin noise I realized what the issue was. In order to get clusters that are large enough to be noticeable, the perlin noise needs to be scaled up. I achieved this effect by calling dividing my i and j by 80 in the call to noise(). This is also noted in the p5 documentation for noise(), where they state that "As a general rule the smaller the difference between coordinates, the smoother the resulting noise sequence will be."

Something interesting that I saw in this project was that using noise() instead of Math.random() to determine the angle of the lines resulted in the "tending-towards-vertical" property (#7). My guess is that that this is because Math.random() has a completely even distribution from 0 to 1, while noise() has less deviation from 0.5.

Also, I think that my observation #10 that "some columns have more vertical-tending lines than others" was completely wrong. Looking closer, it does not seem like column number has any effect on the number of vertical-tending lines. I think that maybe I tricked myself into believing this was true by seeking out some sort of pattern, but in the end it was replicated much better using just noise.

I think that my re-code was pretty successful, and I am glad that the result was simple to achieve. I toggled with values such as line count and length to try and match the original as best as I could.