kadoin-visualization
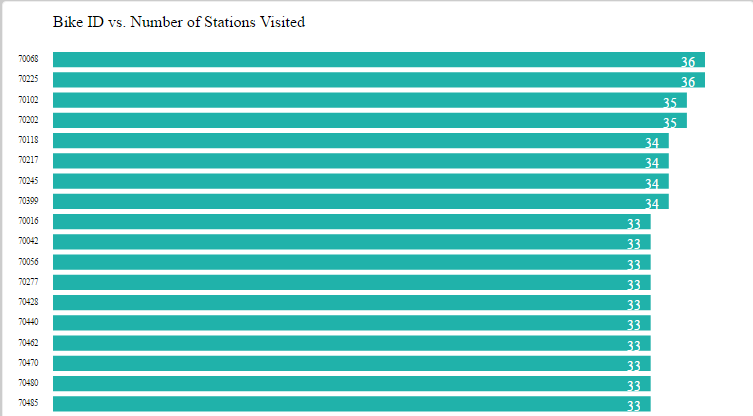
Data vis can be cool and isolating data isn’t so bad, but d3 is a punk and I’d need a bit more practice with it before I think I’d make anything nice with it. I tried to see if any of the bikes went to all the stations and sadly the answer is no. The most worldly of the bikes have only been to 36 stations while some have stayed in one place the entire time.
This graph is pretty meh but it gets the point across I think. A continuation of this project might be a graph that shows a bell curve for the average number of stations visited by a bike.
Overall, data vis ain’t my favorite.
link to the full graph here